
Regular readers of this blog know that there are several concerns to using outcome measures in a higher education accountability system. One of my primary concerns is that outcomes must be adjusted to reflect a college’s inputs—in non-economist language, this means that colleges need to be assessed based on how well they do given their available resources. I have done quite a bit of work in this area with respect to graduation rates, but this same principle can be applied to many other areas in higher education.
The Education Sector also shares this concern, as evidenced by their recent blog post on the importance of input-adjusted graduation measures. In this post (at the Quick and the Ed), Andrew Gillen examines four-year colleges’ performance in student loan default rates. He adjusts for the percentage of Pell Grant recipients, the percentage of part-time students, and the average student loan size to get a measure of student default rate performance.
I repeat this estimate using the most recent loan default data (through 2009-10) and IPEDS data for the above characteristics for the 2009-10 academic year. This simple model does a fair job predicting loan default rates, with a R-squared value of 0.422. Figure 1 below shows actual vs. predicted loan default rates for 1876 four-year institutions with complete data:

The Education Sector analysis did not break down student default rate performance by important institutional characteristics, such as type of control (public, private not-for-profit, or for-profit) or the cost of attendance. Figures 2 and 3 below the performance between public universities and their private non-profit and for-profit peers:
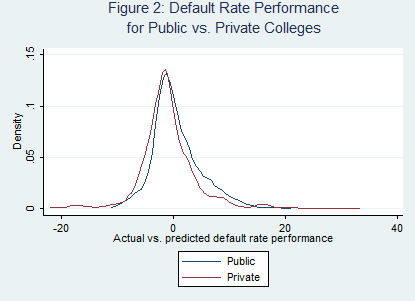
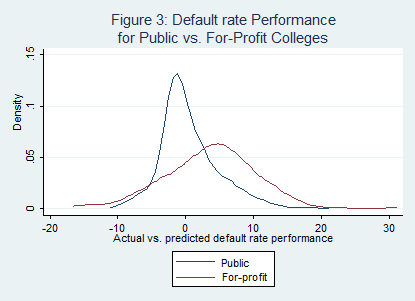
Note: A positive differential means that default rates are higher than predicted. Negative numbers are good.
The default rate performances of public and private not-for profit colleges do not differ in a meaningful way, but a significant number of for-profit colleges have substantially higher than predicted default rates. This difference is obscured when all colleges’ performances are combined.
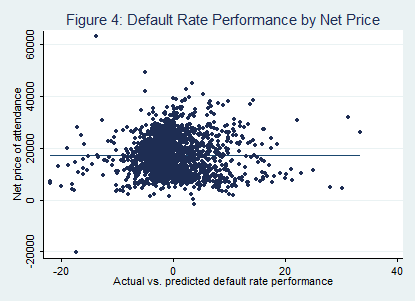
Finally, Figure 4 compares default rate performance by the net price of attendance (the sticker cost of attendance less grant aid) and finds no relationship between the net price and loan default rates:
Certainly, more work needs to be done before adopting input-adjusted student loan default rates as an accountability tool. But it does appear that a certain group of colleges tend to have a higher percentage of former students default, which is worth additional investigation.
