
Millions and millions of Americans will be sitting on the couch over the next several weeks watching the NCAA college basketball tournaments—and I’ll be keeping an eye on my Wisconsin Badgers as the men’s team makes its way through the tournament. Those of us in the higher education community have made a variety of brackets highlighting different aspects of the participating institutions (see Inside Higher Ed’s looks at the men’s and women’s tournaments, using the academic performance rate for student-athletes, and one from The Awl based on tuition, with higher tuition resulting in advancement).
I take a different look at advancing colleges through the tournament—based on having the lowest net price of attendance. Net price is calculated as the total cost of attendance (tuition and fees, room and board, books, and a living allowance) less any grant aid received—among students receiving any grant aid. I use IPEDS data from 2010-11 for this analysis, and also show results if the analysis is limited to students with family income below $30,000 per year (most of whom will have an expected family contribution of zero). Data for the 2013 Net Price Madness Tournament is below:
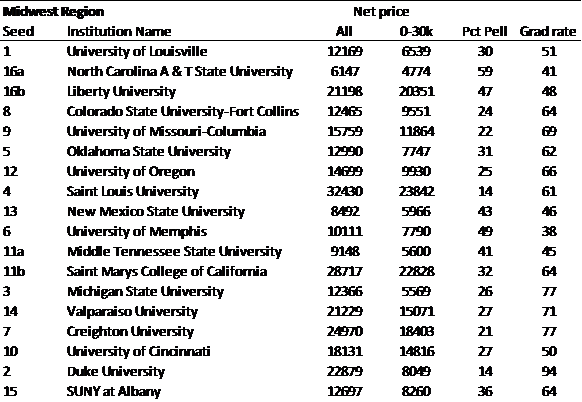
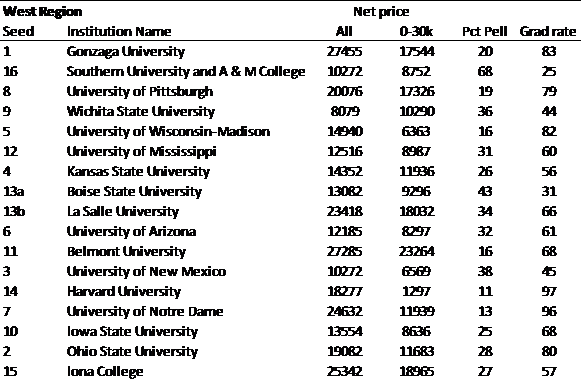
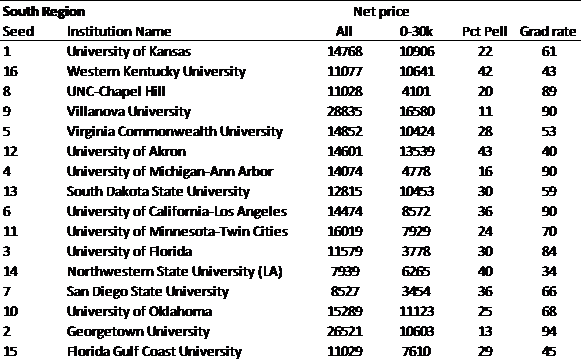
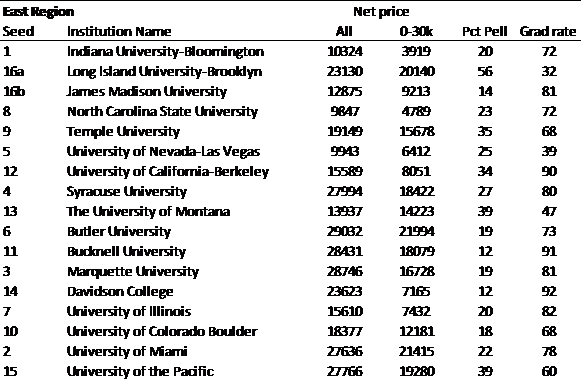
SOURCE: IPEDS.
Overall Net Price
Round of 16
Midwest: North Carolina A&T ($6,147) vs. New Mexico State ($8,492), Middle Tennessee State ($9,148) vs. Albany ($12,697)
West: Wichita State ($8,079) vs. Ole Miss ($12,516), New Mexico ($10,272) vs. Iowa State ($13,554)
South: North Carolina ($11,028) vs. South Dakota State ($12,815), Northwestern State ($7,939) vs. San Diego State ($8,527)
East: North Carolina State ($9,847) vs. UNLV ($9,943), Davidson ($23,623) vs. Illinois ($15,610)
Final Four
North Carolina A&T ($6,147) vs. Wichita State ($8,079)
Northwestern State ($7,939) vs. North Carolina State ($9,847)
WINNER: North Carolina A&T (59% Pell, 41% grad rate)
Net Price (household income below $30k)
Round of 16
Midwest: North Carolina A&T ($4,774) vs. New Mexico State ($5,966), Michigan State ($5,569) vs. Duke ($8,049)
West: Southern University ($8,752) vs. Wisconsin ($6,363), Harvard ($1,297) vs. Iowa State ($8,636)
South: North Carolina ($4,101) vs. Michigan ($4,778), Florida ($3,778) vs. San Diego State ($3,454)
East: Indiana ($3,919) vs. UNLV ($6,412), Davidson ($7,165) vs. Illinois ($7,432)
Final Four
North Carolina A&T ($4,774) vs. Harvard ($1,297)
San Diego State ($3,454) vs. Indiana ($3,919)
WINNER: Harvard (11% Pell, 97% graduation rate)
Depending on which version of net price is used, the results do change substantially. Some colleges dramatically lower their net price of attendance for the neediest students, while others keep theirs more constant in spite of Pell Grant funds being available. Harvard’s victory on the lowest-income measure does ring somewhat hollow, as its percentage of students receiving Pell Grants (11%) tied with Villanova for the lowest in the tournament.
Thanks for reading this post, and feel free to use these picks if you choose to fill out a bracket for the real tournament. Do keep in mind that low net prices and basketball prowess may not exactly be correlated!

5 thoughts on “The 2013 Net Price Madness Tournament”
Comments are closed.