
It’s time for my second annual Net Price Madness Tournament, in which colleges which have men’s basketball teams in the NCAA Division I tournament are ranked based on net price in a tournament format. In last year’s Net Price Madness, North Carolina State, North Carolina A&T, Northwestern State (LA), and Wichita State were the regional winners for the lowest net price among students who received any financial aid in the 2011-12 academic year. And the Shockers did go on to advance to the Final Four, so maybe this method has a tiny correlation to basketball success!
Here are the results for the 2014 Net Price Madness Tournament in a convenient spreadsheet that also includes winners for each game, net price by income level, percent Pell, and six-year graduation rates. The regional winners for 2014 are:
East: North Carolina Central University (14): $8,757 net price, 64% Pell, 43% grad rate
Midwest: Wichita State University (1): $8,645 net price, 36% Pell, 41% grad rate
South: University of New Mexico (7): $11,001 net price, 39% Pell, 46% grad rate
West: University of Louisiana-Lafayette (14): $5,891 net price, 35% Pell, 44% grad rate
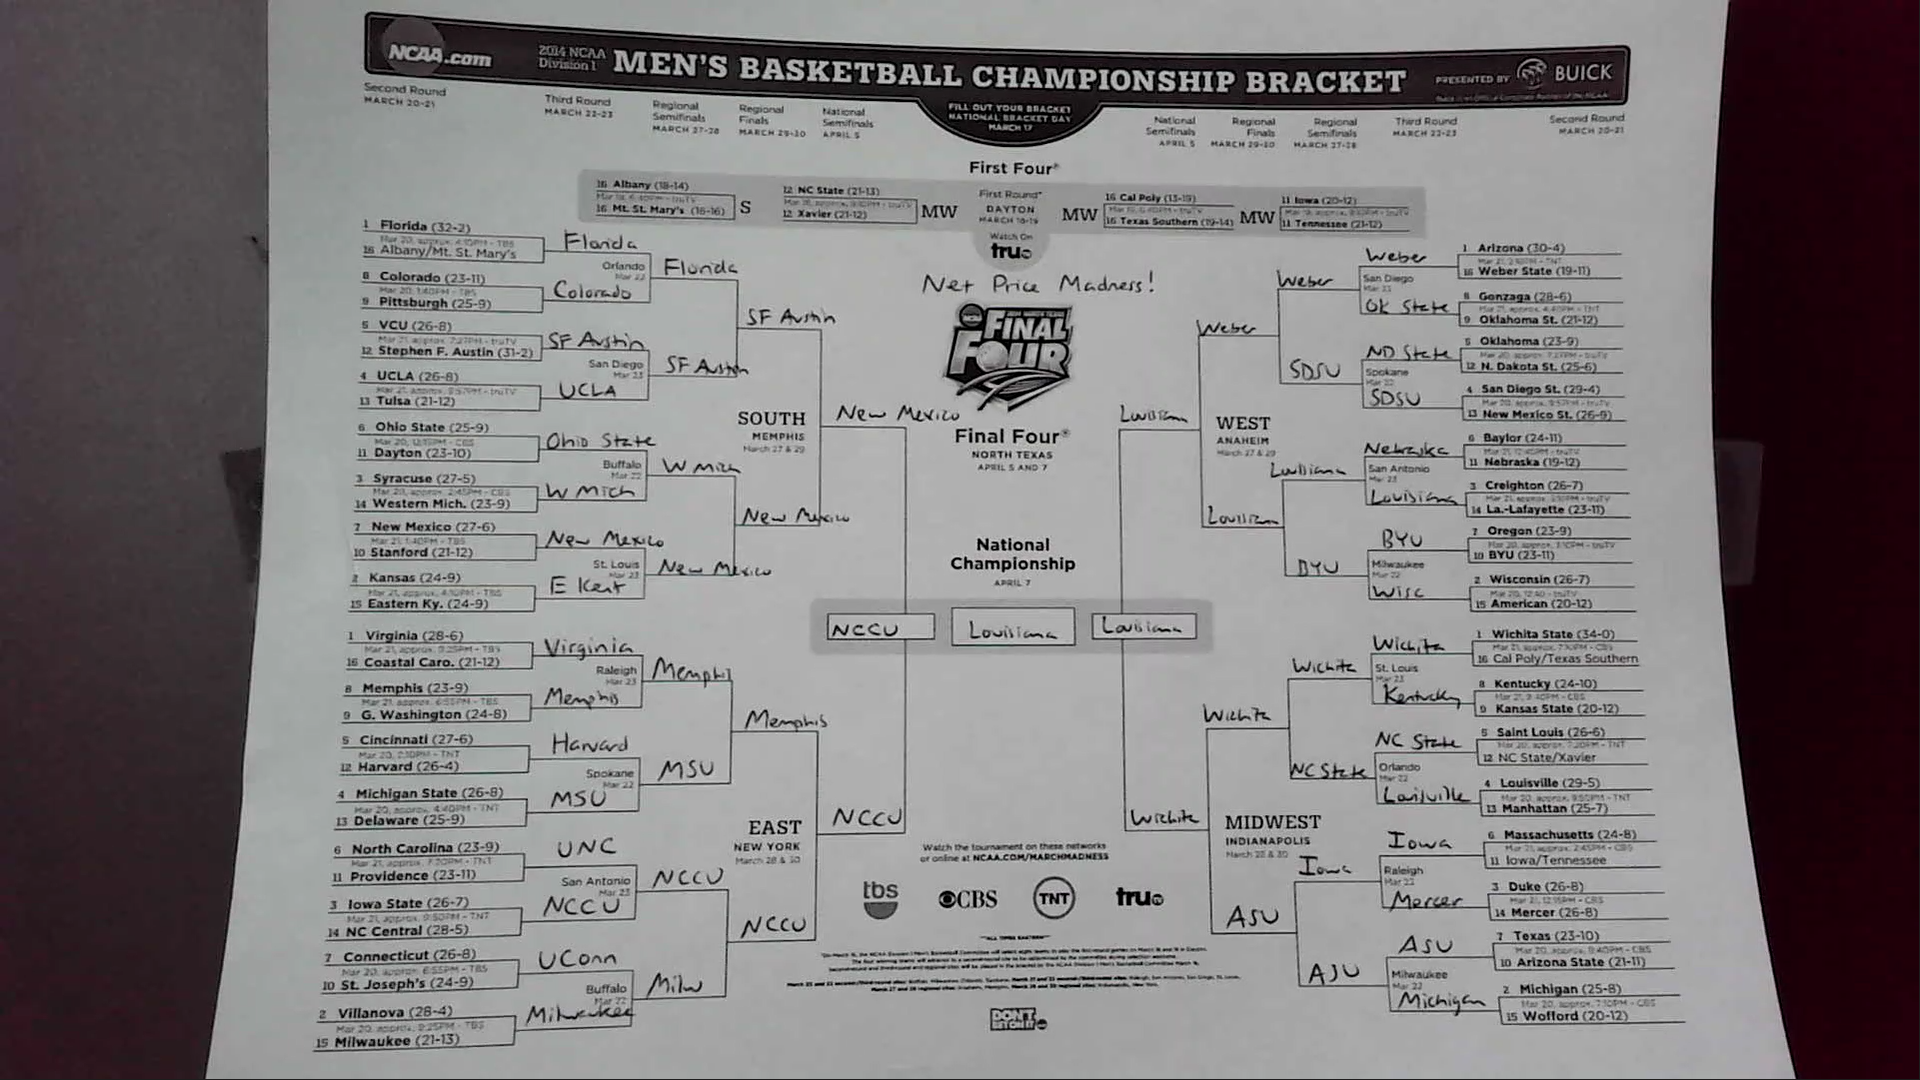
And here is the full bracket:
Congratulations to these institutions, and a big raspberry to the nine colleges that charged a net price of over $20,000 to the typical student with household income below $30,000 per year. Feel free to use these data to inform your rooting interests!
UPDATE 3/17 Noon ET: Mark Huelsman of Demos drew my attention to the oddity that Wichita State’s net price for all students ($8,645) is far lower than the net price for each of the three lowest income brackets (roughly $12,500 to $13,500). I investigated the IPEDS data report from WSU and discovered that 706 of the 721 WSU first-year, full-time, in-state students receiving Title IV financial aid (listed as Group 4) were reported as having incomes below $30,000 in 2011-12; similar percentages existed for the previous two years.
The sample for the full net price number is somewhat different–it’s first-year, full-time, in-state students receiving any grant aid (including the institution, listed as Group 3). This sample has 902 students, 179 more than the previous sample. Comparing net tuition revenue from the two groups, Group 4 had roughly $9.5 million in net revenue in 2011-12 and the larger Group 3 had $7.8 million in net revenue. This is unusual, to say the least, and it is possible that one of the net price numbers listed in IPEDS is incorrect. I’m continuing to investigate this point.

4 thoughts on “The 2014 Net Price Madness Tournament”
Comments are closed.