
In my third blog post using newly-released data from the 2015-16 National Postsecondary Student Aid Study (NPSAS), I turn my attention away from graduate and professional students and toward undergraduate students. Here, I update a 2015 article that I wrote for the Journal of Student Financial Aid examining trends in the share and types of students who have an expected family contribution of zero—the students who have the least financial ability to pay for college and thus qualify for the maximum Pell Grant.
Using the handy TrendStats tool on the National Center for Education Statistics’s DataLab website, I looked at six NPSAS waves from the 1995-96 to 2015-16 and pulled data for all students and then by student and institutional characteristics. The full spreadsheet can be downloaded here (including data by gender and age that I do not cover in this post), and I go through some of the highlights below.
Overall, the percentage of students with a zero EFC has steadily increased every four years since the 1999-2000 academic year in spite of ebbs and flows in the economy. Part of this is likely due to changes in the rules of who automatically qualifies for a zero EFC based on family income and means-tested benefit receipt (currently, the income limit is $25,000 per year), but increased student diversity in American higher education also plays a role. The percentages in each year are as follows:
1995-96: 18.6%
1999-2000: 17.7%
2003-04: 20.7%
2007-08: 25.4%
2011-12: 37.9%
2015-16: 39.1%
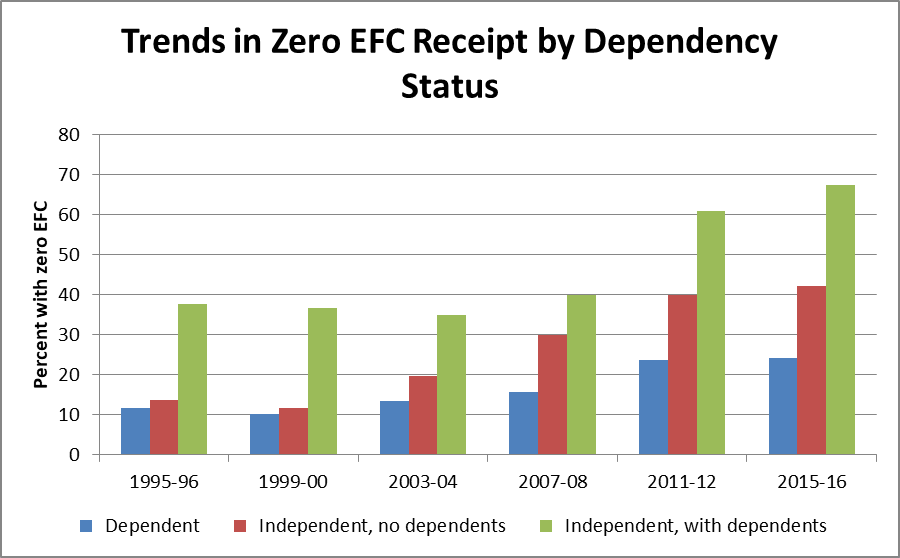
There are stark differences in the percentage of students with a zero EFC by dependency status that have grown larger over time. Independent students with dependents of their own have always been the most likely to have a zero EFC, especially because childcare obligations often limit work hours (resulting in a lower household income). The percentage of students in this category with a zero EFC remained between 35 and 40 percent through 2007-08 before spiking to 61% in 2011-12 and 67.3% in 2015-16. Dependents and independent students with no dependents had generally similar zero EFC rates in the teens through 2003-04, but then independent students started to qualify for zero EFCs at much higher rates. By 2015-16, the gap grew to 18 percentage points (42.2% versus 24.2%).
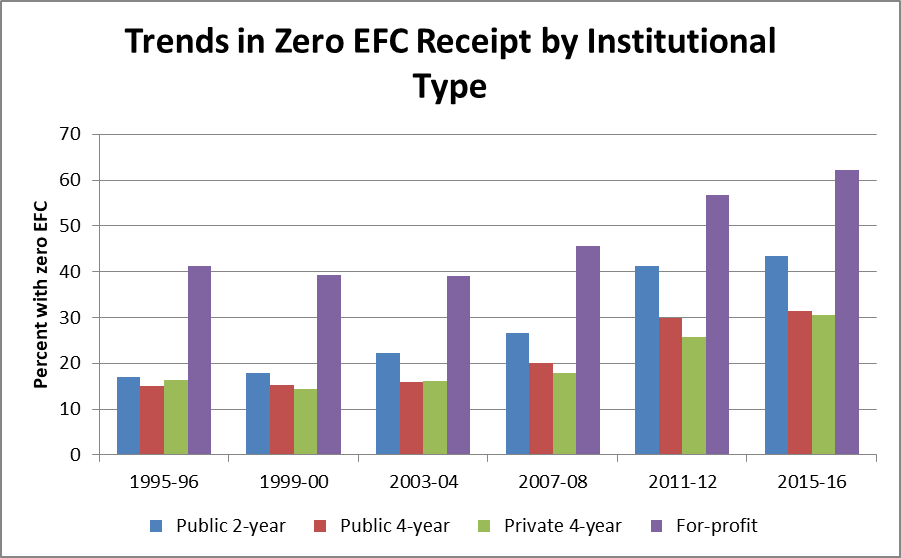
 Turning next to institutional type, for-profit colleges (which tend to enroll more independent students with families of their own) have traditionally had higher zero EFC rates than other sectors. 62.2% of students at for-profits had a zero EFC in 2015-16, up from 56.8% in the last NPSAS wave and around 40% before the Great Recession. In the 1990s, community colleges, public 4-year colleges, and private nonprofit 4-year colleges all had zero EFC rates of around 15%. Community colleges’ rates passed 40% in 2011-12, while four-year public and nonprofit colleges’ rates exceeded 30% in 2015-16. Notably, the percentage of zero EFC students at four-year private nonprofit colleges jumped from 25.7% to 30.5% in this NPSAS wave, a much larger increase than among public 4-year colleges.
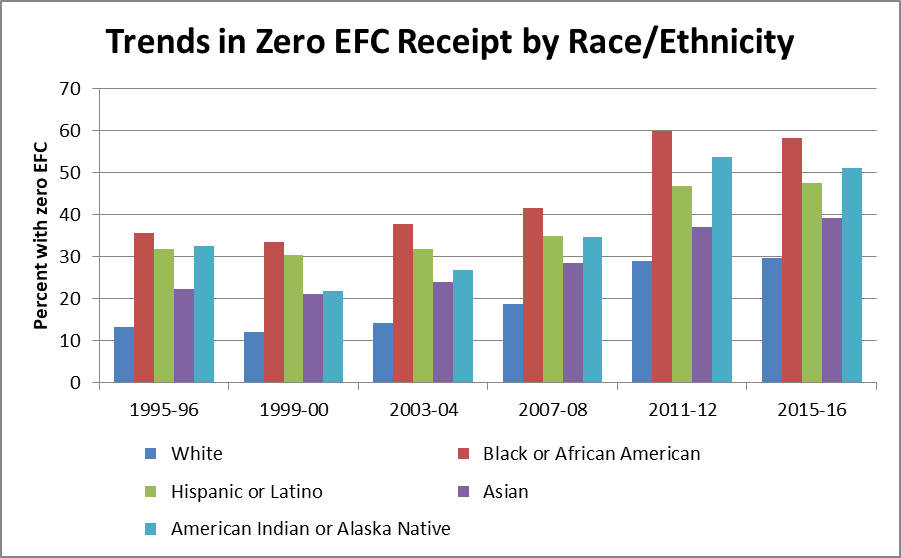
 Readers of my last two blog posts should not be terribly surprised to see that African-American students have been the most likely to have a zero EFC across the last six NPSAS administrations, although there was a slight decrease between 2011-12 and 2015-16 (60.0% to 58.2%). American Indian/Alaska Native students had the next highest zero EFC percentage (51.2%), followed by Hispanic/Latino students (47.6%), Asian students (39.2%), and white students (29.8%). Multiracial students saw an increase in zero EFC rates from 39.1% to 41.8%, but this group is not shown in the chart due to changes in how the Department of Education has classified race and ethnicity over time.
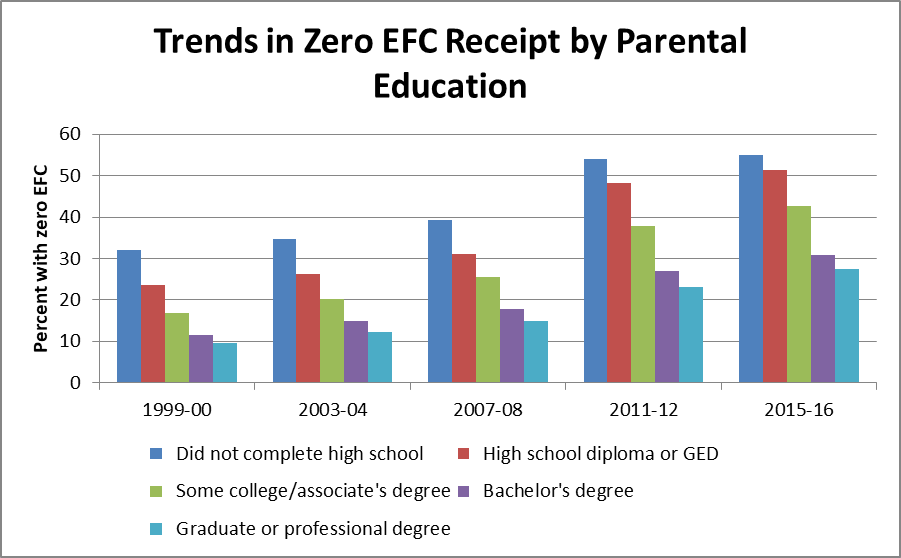
 Finally, I examine zero EFC receipt trends by parental education—beginning in the 1999-2000 academic year due to changes in the survey question following the 1995-96 NPSAS. There is a clear relationship between parental education and zero EFC rates, with more than half of all students whose parents never attended college having a zero EFC in 2015-16 and progressively lower rates for students with highly-educated parents. However, two trends stand out among non-first-generation students. The largest increase in zero EFC rates by parental education in the last two NPSAS waves was among families with some college experience or an associate degree (rising from 37.9% to 42.6%). Meanwhile, even among students who had at least one parent with a graduate degree, 27.5% still qualified for a zero EFC.
 Readers, if there are any pieces of the new NPSAS data that you would like me to examine in a future blog post, leave me a note in the comments section or send me a tweet. I’m happy to dig into other pieces of the dataset!
