
It has been a busy stretch for higher education data over the last month. December saw a release of financial aid, admissions, and graduation rate data through the Integrated Postsecondary Education Data System (IPEDS) and a substantial release of program-level debt and earnings data in advance of this week’s negotiated rulemaking sessions. The National Center for Education Statistics continued its efforts to release data with a limited staff by publishing an additional year of data on fall enrollment, staff, and finance this week—concluding the 2025-26 release cycle.
Given my research, it is no surprise that I was eagerly awaiting the most recent year of finance data (covering Fiscal Year 2024). While getting data about 18 months after fiscal years end is not terribly helpful to evaluate the condition of colleges teetering on the brink of closure, it is a useful metric of the (somewhat delayed) financial health of institutions.
For the last couple of years, I have taken a look at colleges that consistently lose money. I am continuing that trend with the newest year of data, but looking more broadly at losses across institutional sector (degree-granting institutions only, excluding Carnegie-designated special-focus institutions).
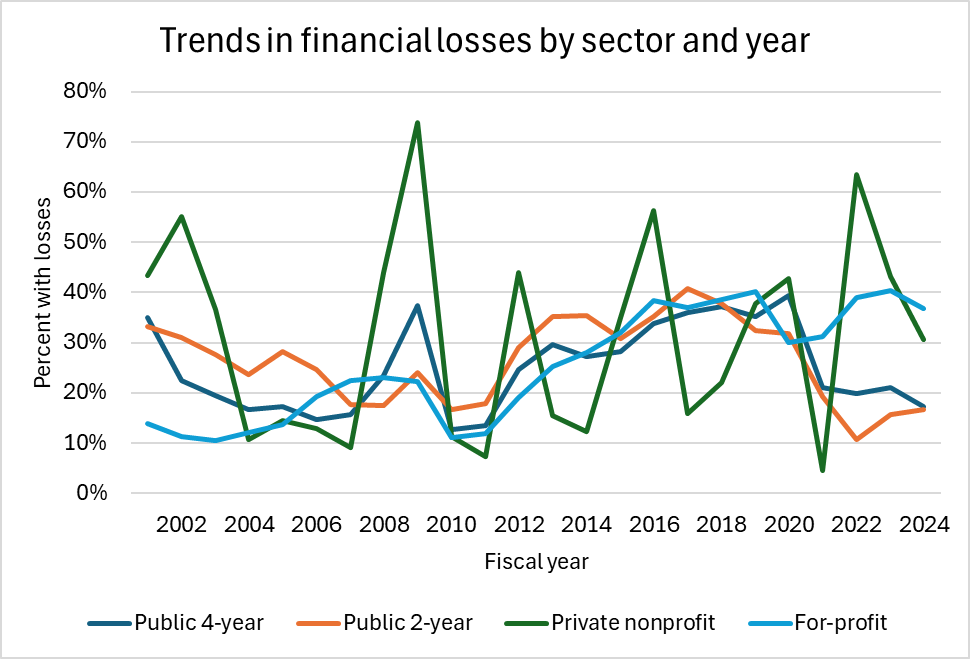
The first figure is the share of colleges by sector and year that lost money from Fiscal Year 2001 to 2024. The first thing that jumps out is the volatility of private nonprofit colleges, as stock market gyrations can result in relatively weak colleges posting gains and Ivy League institutions posting massive losses in certain years. But overall, the trend in the last few years has been positive for public colleges and mixed to negative for private colleges. In Fiscal Year 2024 (a strong year for the stock market and for appropriations in many states), 17% public institutions posted losses compared to 31% of private nonprofit and 37% of for-profit institutions. Public institutions posted higher rates of losses—close to 40%–in the late 2010s, while the worst year in recent memory for private nonprofits was 2022 at 64%.
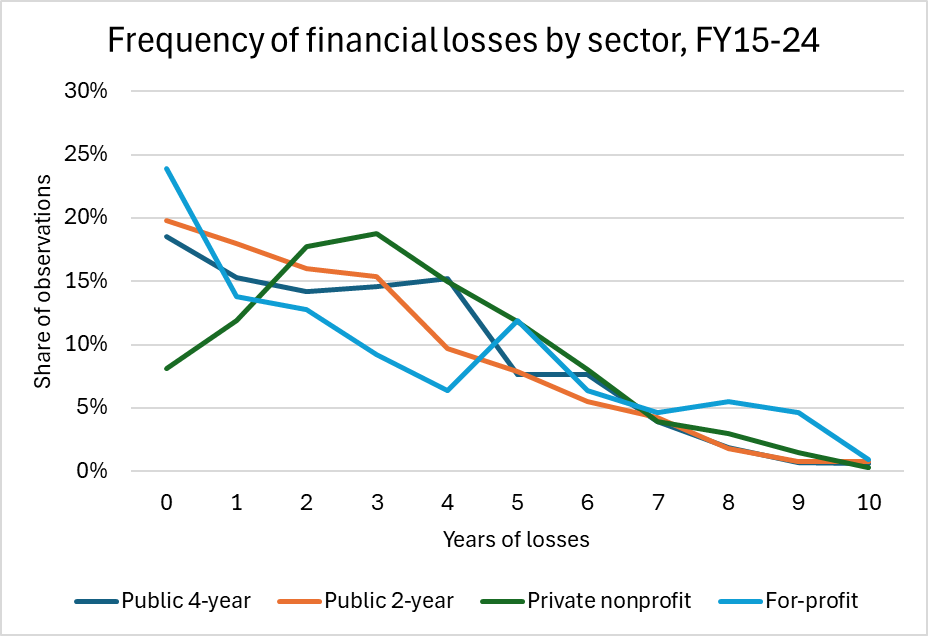
The second figure is the frequency of financial losses over the last ten years. Conditional on reporting data throughout the decade, the median institution across all sectors lost money in approximately 2-3 years. Nearly 20% of public institutions and 25% of for-profit colleges never lost money, compared to just eight percent of for-profits. On the other hand, ten percent of for-profit colleges and five percent of private nonprofits lost money in at least eight years compared to just 1-2 percent of public institutions.
I compiled a spreadsheet (available for download) of degree-granting institutions’ financial data over the last decade, sorted by the number of years that the institution lost money. For each year, there is a column for revenues and expenses (in millions) and whether the institution lost money. Judging by the reactions that I have received over the last couple of years, this has been a useful service to the field.
The obvious question is what the trend looks like for institutional finances going forward. Fiscal Year 2025 likely looked pretty good due to continued solid state funding, solid endowment returns, and most of the Trump administration’s research cuts only affecting the end of the fiscal year. But I expect the share of institutions that lose money to increase substantially in the current fiscal year due to federal, state, and economic pressures.

Volatility tied to stock market fluctuations is what jumped out for me.
The fact that “weak colleges” can look better during bull markets reflects the financialization of higher education (through endowments, hedge‑fund‑style strategies, and complex asset allocations), and “paper” value, rather than educational outcomes — an artifact of fair‑value accounting applied to financialized balance sheets, but not evidence of managerial success or failure.
What portion of overall health has been financialized this way? How does this embeddedness in capital markets vary across the sector itself?
Ironic how so little of these up-side gains filter down to lower tuition costs, etc., and how all this quickly becomes tragic during market corrections, when ‘risk’ shifts from institutions to students and workers that bear the consequences and when volatility translates into cuts, tuition hikes, or program closures.
In the context of neoliberal financialization, to what extent are schools effectively acting as leveraged portfolio managers whose reported health is inseparable from broader asset price cycles?
How many other schools are like Harvard, a $37 billion dollar tax-free hedge fund with a university attached?
Take a college with a $100 million annual budget and a $50 million endowment (spitting out enough money to cover about 2.5% of operating costs). If the stock market goes up by 15%, there would be a $7.5 million investment gain that could paper over a budget deficit. That’s enough to swing returns without a huge financial cushion.
Robert, where’s the bottom? And how bad can it get? Glen McGhee, Bryan Alexander, a I have been following this College Meltdown for so long it seems like a nightmare. Declining enrollments, tens of millions with student loan debt, oppressed adjuncts, a growing educated underclass, and more skepticism about higher education in general.
Higher Education Inquirer : Beyond the College Meltdown: Moral Decay, Dehumanization, and the Failure of Courage (Dahn Shaulis and Glen McGhee)
Higher Education Inquirer : The Five Pillars of the College Meltdown
Higher Education Inquirer : Forecasting the U.S. College Meltdown: How Higher Education Inquirer’s 2016 Warnings Played Out, 2016–2025 (Glen McGhee)
Enrollment as a whole is up a bit in the last couple of years, but other financial pressures are growing. The bigger concern is for less-selective four-year colleges, which are losing students to other bigger-name (and better-resourced) institutions.