
I’m fortunate to be teaching a class in higher education finance this semester, as it’s a class that I greatly enjoy and is also intertwined with my research interests. I’m working on slides for a lecture on grant aid (both need-based and merit-based) in the next few weeks, which involves creating graphics about trends in aid. In this post, I’m sharing two of my graphics about state-level financial aid.
States have taken different philosophies regarding financial aid. Some states, particularly in the South, have focused more of their resources on merit-based aid, rewarding students with strong pre-college levels of academic achievement. Other states have put their resources into need-based aid, such as Wisconsin and New Jersey. Yet others have chosen to keep the cost of college low instead of providing aid to students.
The two charts below demonstrate the states’ differences in philosophies. The state-level data come from the National Association of State Student Aid & Grant Programs (NASSGAP) from the 2011-12 academic year. The first chart shows the percentage of funds given to need-based aid (green) and merit-based aid:
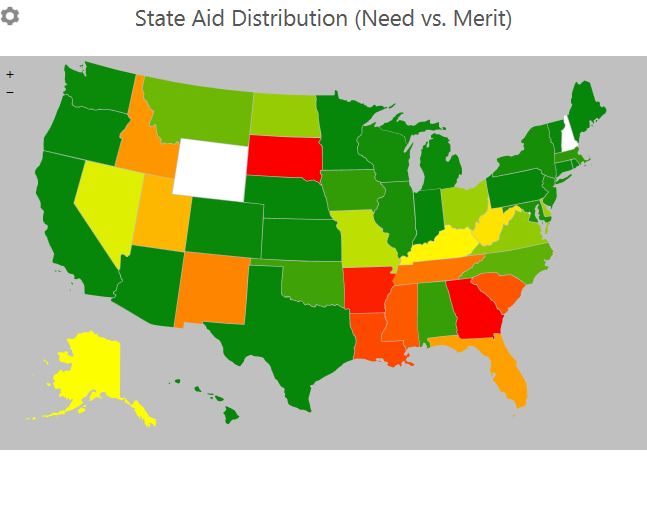
Two states currently have no need-based aid (Georgia and South Dakota), and six other states allocate 75% or more of state aid to merit-based programs. On the other hand, nine states only have need-based aid programs and 16 more allocate 90% or more to need-based aid. Two states (New Hampshire and Wyoming) did not report having student aid programs in 2011-12.
The second chart measures the intensity of spending on state-level student aid. I divide overall spending by the state’s population in 2012, as estimated by the Census Bureau. States with more spending on aid per student are in green, while lower-spending states are in red:
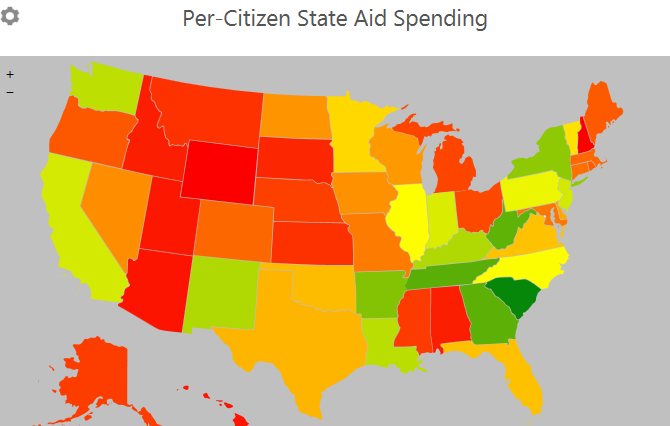
South Carolina leads the way in state student aid, with nearly $69 per resident; four other Southern states provide $50 or more per resident. The other extreme sees 15 states spending less than $10 per person on aid.
Notably, states with more of an emphasis on merit aid spend more on per-resident aid. The correlation between the percentage of funds allocated to need-based aid and per-resident spending is -0.33, suggesting that merit-based programs (regardless of their effectiveness) are more capable of generating resources for students.
I’m looking forward to using these graphics (and several others) in my class on grant aid, as the class has been so much fun this semester. I hope my students feel the same way!
