
The U.S. Department of Education recently released its annual report on the federal Pell Grant program, which provides detailed information about the program’s finances and who is receiving grants. The most recent report includes data from the 2015-16 academic year, and I summarize the data and trends over the last two decades in this annual post on the status of the Pell program. (Very preliminary data on Pell receipt for the first two quarters of the 2016-17 academic year can be found in the Title IV program volume reports on the Office of Federal Student Aid’s website.)
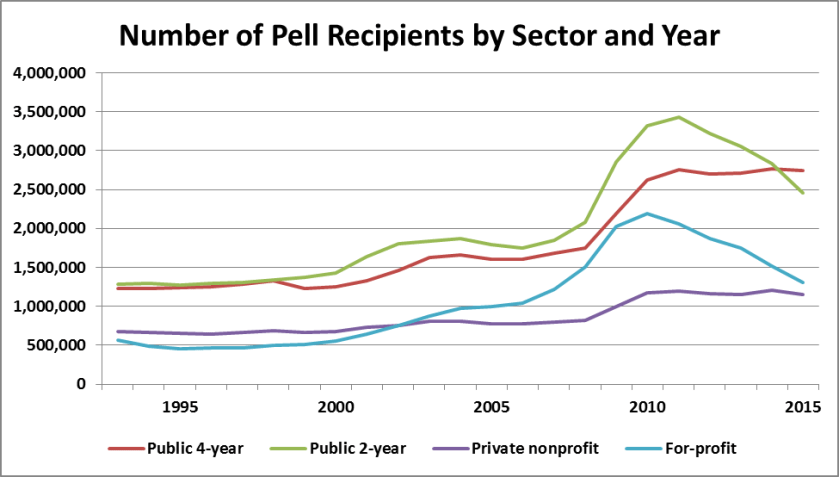
The number of Pell recipients fell for the fourth year in a row in 2015-16 to 7.66 million. This represents a 7.9% decline in the last year and an 18.9% drop since the peak in 2011-12. The decline is steepest in the for-profit sector (down 13.9% in one year and 36.7% since 2011-12) and among community colleges (down 13.3% and 28.3%, respectively), while private nonprofit and public four-year colleges stayed relatively constant. For the first time since at least 1993, more students at public four-year colleges received Pell Grants than community college students. While most of this change is likely due to a drop in community college enrollment, some could be due to community colleges offering a small number of bachelor’s degrees being counted as four-year colleges. (Thanks for Ben Miller of the Center for American Progress for pointing that out!)
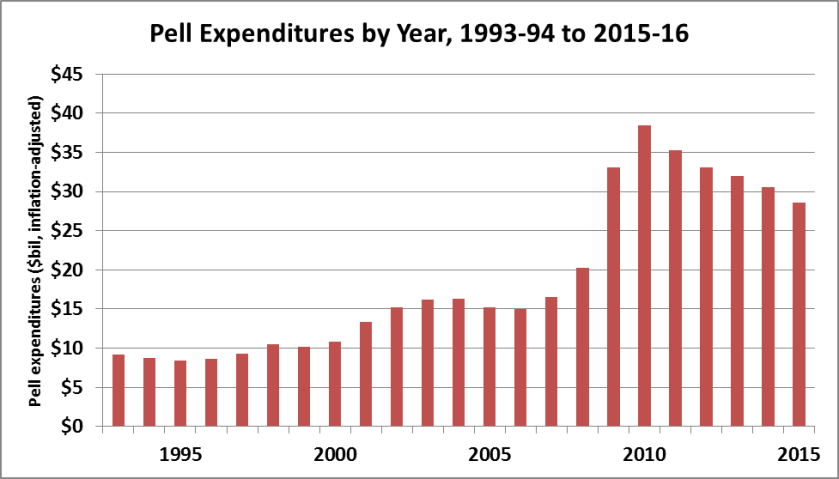
Pell Grant expenditures fell to $28.6 billion in 2015-16, down from $35.7 billion in 2010-11. After adjusting for inflation, program expenditures are down 26% since the peak. This has allowed the Pell program to develop a surplus of $10.6 billion, $1.3 billion of which was taken to use for other programs in the 2017 budget deal. This surplus also allowed for the Pell Grant to be available for more than two semesters per year as of July 1, which was allowed between 2008 and 2011 before being cut due to budgetary concerns.
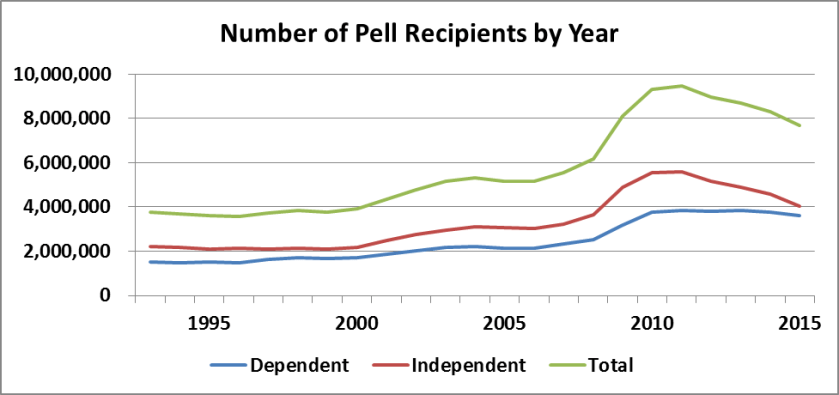
Most of the decline in Pell enrollment and expenditures can be attributed to a drop in the number of students who are considered independent for financial aid purposes (typically students who are at least 24 years of age, are married, or have a child). The number of independent Pell recipients fell by 28% in the last four years (to 4.05 million), while the number of dependent Pell recipients fell by just 6.4% (to 3.61 million), as shown in the chart below. However, independent students still make up the majority of Pell recipients, as they have every year since 1993.
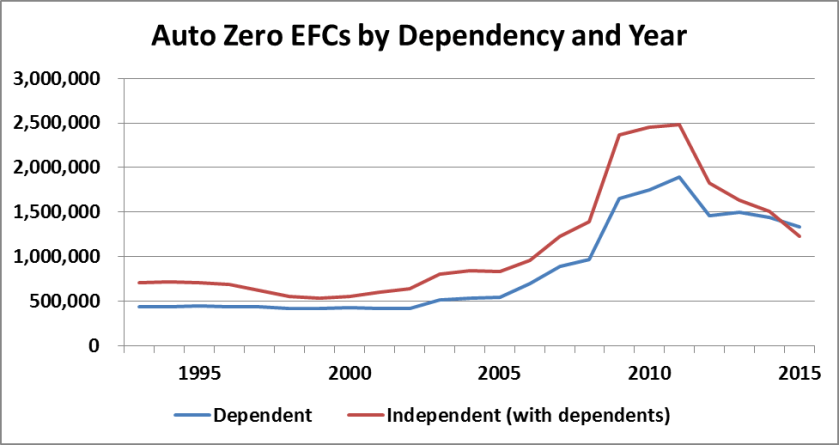
There has been an even larger drop in the number of students with an automatic zero expected family contribution, who automatically qualify for the maximum Pell Grant based on family income and receiving means-tested benefits. (For more on these students, check out this article I wrote in the Journal of Student Financial Aid in 2015.) The number of independent students with dependents who received an automatic zero EFC fell by 50% since 2011-12, while the number of dependent students in this category fell by 29%. (Independent students without any dependents are not eligible to receive an automatic zero EFC.) Part of this decline was due to a decrease in the maximum income limit that automatically qualified students for an automatic zero EFC, while the rest can be attributed to an improving economy that has both induced adult students to return to the labor market and raised some incomes beyond the threshold for qualifying for an automatic zero EFC.

One thought on “Examining Trends in the Pell Grant Program”
Comments are closed.