
Mistakes happen. I should know—I make more than my fair share of them (including on this blog). But some mistakes are a little more noticeable than others, such as when your mistake has been viewed more than a million times. That is what happened to the U.S. Department of Education recently, when they found a coding error in the popular College Scorecard website and dataset.
Here is a description of the coding error from the Department of Education’s announcement:
“Repayment rates measure the percentage of undergraduate borrowers who have not defaulted and who have repaid at least one dollar of their principal balance over a certain period of time (1, 3, 5, or 7 years after entering repayment). An error in the original college scorecard coding to calculate repayment rates led to the undercounting of some borrowers who had not reduced their loan balances by at least one dollar, and therefore inflated repayment rates for most institutions. The relative difference—that is, whether an institution fell above, about, or below average—was modest. Over 90 percent of institutions on the College Scorecard tool did not change categories (i.e., above, about, or below average) from the previously published rates. However, in some cases, the nominal differences were significant.”
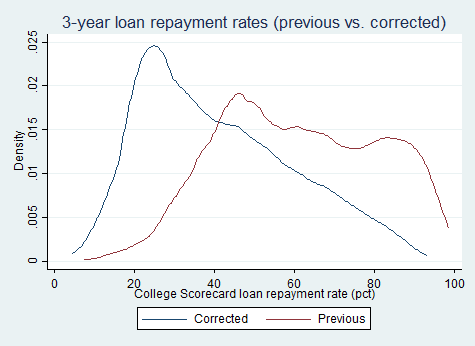
As soon as I learned about the error, I immediately started digging in to see how much it affected loan repayment rates. After both my trusty computer and I made a lot of noise trying to process the large files in a short period of time, I was able to come up with some top-level results. It turns out that the changes in loan repayment rates are very large. Three-year repayment rates fell from 61% to 41%, five-year repayment rates fell from 61% to 47%, and seven-year repayment rates fell from 66% to 57%. These changes were quite similar across sectors.
| Difference between corrected and previous loan repayment rates (pct). | ||||
| Corrected | Previous | Difference | N | |
| All colleges | ||||
| 3-year | 41.0 | 61.0 | -20.0 | 6,090 |
| 5-year | 47.1 | 61.1 | -14.0 | 5,842 |
| 7-year | 56.7 | 66.3 | -9.6 | 5,621 |
| Public | ||||
| 3-year | 46.6 | 66.8 | -20.2 | 1,646 |
| 5-year | 54.2 | 68.9 | -14.7 | 1,600 |
| 7-year | 62.1 | 72.1 | -10.0 | 1,565 |
| Private nonprofit | ||||
| 3-year | 57.7 | 77.5 | -19.8 | 1,386 |
| 5-year | 63.7 | 77.3 | -13.6 | 1,375 |
| 7-year | 70.4 | 79.3 | -8.9 | 1,338 |
| For-profit | ||||
| 3-year | 30.5 | 50.4 | -19.9 | 3,058 |
| 5-year | 35.0 | 48.9 | -13.9 | 2,850 |
| 7-year | 46.9 | 56.5 | -9.6 | 2,700 |
| Source: College Scorecard. | ||||
For those who wish to dig into individual colleges’ repayment rates, here is a spreadsheet of the new and old 3, 5, and 7-year repayment rates.
Fixing the coding error made a big difference in the percentage of students who are making at least some progress repaying their loans. (And ED’s announcement yesterday that it will create a public microdata file from the National Student Loan Data System will help make these errors less likely in the future as researchers spot discrepancies.) This change is likely to get a lot of discussion in coming days, particularly as the new Congress and the incoming Trump administration get ready to consider potential changes to the federal student loan system.

Obviously, this is a big screw-up and suggests that the loan repayment problem is worse than we might have thought. However, I’m wondering if there is a way to calculate how many of those counted as “not repaying any of the principal on their loans” are actually in deferment or actually making payments but as part of income-based repayment and, therefore, not yet paying back any principal? Just seems like, if that number is pretty high, then the situation may not be as dire as it looks? Am I missing something here?
Thanks for the comment. This is something that I really want to know, but we can’t tell given the available data. It would be very helpful to know the percentage of students current on their standard repayment plans, the percent in income-driven plans, the percent in deferment/forbearance, and the percentage who are falling behind.
Thanks for the analysis. Would the overall repayment rates change much if weighted for the number of borrowers from each institution? Wondering if some over-performing or under-performing institutions would disproportionately skew the overall rates. Or is the 41% 3-year repayment rate already weighted to account for this? Thanks.
Hi Tyler,
Thanks for your question. The above analysis was unweighted and by UnitID (meaning that some colleges in a system had the same values if they shared a Federal Student Aid OPEID). I weighted and ran the results by OPEID:
3-year repayment rate: New 43.6%, old 63.8%, n=4,158
5-year repayment rate: New 39.8%, old 50.8%, n=3,927
7-year repayment rate: New 62.1%, new 72.2%, n=3,736
So the percentages change some here, but the general trends stay the same.
Professor, thank you for your work. Do you have data that shows the actual dollar amounts of government guaranteed loans by For-Profit versus Not-for-Profit schools? Am I correct to believe that repayment rates are lower for For-Profit schools but the dollar amount of defaulted For-Profit loans are significantly smaller than defaulted Not-For-Profit loans. Have you analyzed this data from the standpoint of taxpayer exposure to defaulted student debt by school type? Thank you.
Repayment rates are definitely lower for the average for-profit college compared to the average nonprofit college, but the Department of Education doesn’t make great data available on the dollar amount of loans in default. So I can’t really answer the question that you ask, which is frustrating given how important it is to taxpayers and policymakers.