
Over the last two years, the U.S. Department of Education’s Office of Federal Student Aid has quietly released additional data on the federal government’s portfolio of nearly $1.4 trillion in student loans. I was on the FSA website today looking up the most recent data on Public Service Loan Forgiveness employment certification forms (up to 740,000 filed as of September 30) for a paper I am currently drafting when a new set of spreadsheets on the income-driven repayment (IDR) programs caught my eye.
Overall, just over $375 billion of the $1.05 trillion in federal Direct Loans is now enrolled across the various types of IDR programs. (The rest of the federal loan portfolio is in the old FFEL program, which does not make new loans.) This is up from $269 billion of loans in IDRs when I last wrote about the topic on my blog in mid-2016, which has implications for both students and taxpayers alike. Here, I summarize some of the new data on the types of borrowers who use IDR, as well as some of the other data elements that would be helpful to have going forward.
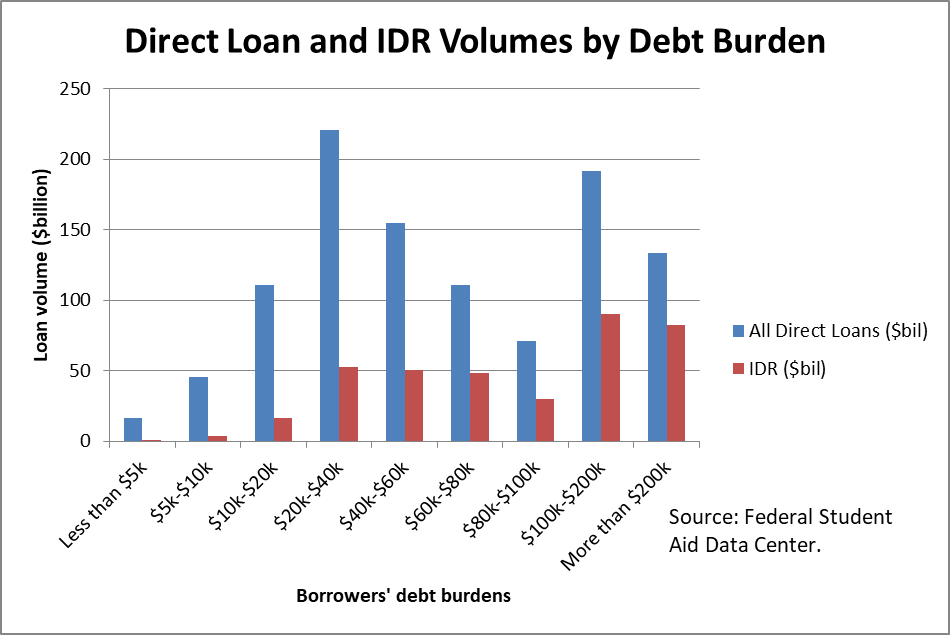
It is not surprising that students with more debt are more interested in income-driven repayment plans, as many borrowers with less debt could manage payments under the standard ten-year repayment plan. But I was surprised by how much of the debt is held by a small percentage of borrowers. About 1.9 million of the 35.3 million borrowers (or five percent) have more than $100,000 in debt—and this is primarily due to graduate school attendance (since undergraduates cannot borrow more than $57,500 without resorting to PLUS loans). Yet these borrowers hold $325 billion in Direct Loans, or about 30% of all loans outstanding. About $173 billion of this amount is enrolled in IDR plans—53% of all debt held by those with six-figure debts. On the other hand, less than one-fourth of all debt of borrowers with less than $40,000 outstanding is enrolled in IDR. The table and figure below show the amount of Direct Loans outstanding and the amount enrolled in IDR by debt burden.
(UPDATE 2/1/18: As a commenter noted below, there is a small percentage of loans from the old FFEL program in income-driven repayment plans. But as far as I can tell from the data, this only slightly overstates the percentage of Direct Loans in IDR. I’m confident that the general trends still hold, though.)
| Table 1: Direct Loan and IDR volumes by debt burden. | |||
| Amount of debt | All Direct Loans ($bil) | IDR ($bil) | Pct of loans in IDR |
| Less than $5k | 16.9 | 0.9 | 5.3% |
| $5k-$10k | 45.6 | 4.0 | 8.8% |
| $10k-$20k | 110.7 | 16.7 | 15.1% |
| $20k-$40k | 220.6 | 52.9 | 24.0% |
| $40k-$60k | 154.6 | 50.9 | 32.9% |
| $60k-$80k | 110.5 | 48.2 | 43.6% |
| $80k-$100k | 71.3 | 30.3 | 42.5% |
| $100k-$200k | 191.7 | 90.5 | 47.2% |
| More than $200k | 133.5 | 82.3 | 61.6% |
| Total | 1055.4 | 376.7 | 35.7% |
 I also examined new FSA data on Direct Loan and IDR volumes by age (Table 2 below) and institution type (Table 3). The data show that younger borrowers (between ages 25 and 49) have a higher percentage of dollars in IDR than older borrowers and that students who attended private nonprofit and for-profit colleges rely on IDR more heavily than students who went to public colleges. The finding by sector matches general patterns in tuition and fees, but it does not suggest that for-profit college students disproportionately turn to IDR to manage their loan burdens.
| Table 2: Direct Loan and IDR volumes by age of borrower. | |||
| Age | All Direct Loans ($bil) | IDR ($bil) | Pct of loans in IDR |
| 24 or younger | 128 | 9.2 | 7.2% |
| 25-34 | 418.3 | 177.4 | 42.4% |
| 35-49 | 337.9 | 139.8 | 41.4% |
| 50-61 | 140.5 | 39 | 27.8% |
| 62 or older | 30.6 | 11.3 | 36.9% |
| Total | 1055.3 | 376.7 | 35.7% |
| Table 3: Direct Loan and IDR volumes by institutional type. | |||
| Sector | All Direct Loans ($bil) | IDR ($bil) | Pct of loans in IDR |
| Public | 464.2 | 143.3 | 30.9% |
| Private nonprofit | 337 | 126.5 | 37.5% |
| For-profit | 176.6 | 63.6 | 36.0% |
| Total | 977.8 | 333.4 | 34.1% |
There are two additional data elements that would be extremely useful in considering the implications of income-driven repayment plans. Ideally, data on IDR takeup would be available at the institutional level (as I have politely requested in the past). But at the very least, a breakdown by undergraduate/graduate student status would be useful information.
And one final request of any journalists or qualitative researchers who may be reading this blog—I would love to know more about how the PSLF approval process is going now that some borrowers have made the 120 monthly payments necessary to qualify for forgiveness. It’s been strange not to hear anything about that process after applications could be submitted as early as October 2017.

These are apples and oranges. Some of the data sets include only Direct Loans. Others include both Direct Loans and ED-serviced FFELs. For example, Table 1 takes total ED-serviced IDR (Direct Loan + ED-serviced FFEL) and divides by a DL-only number.
Anything “at the institutional level” would be somewhat of an estimate, due to the prevalence of consolidation loans in IDR plans. Consolidation loans do not have a specific school or school type, and tracking them back to the originally-incurred debt requires some assumptions. As the discussions during the 2010 GE negotiations indicated, allocating current consolidation debt to specific schools is not a straightforward exercise.
“REPAYE does a particularly good job keeping people current on their loans relative to other types of income-driven repayment and standard plans.” Not exactly.
https://ifap.ed.gov/eannouncements/040618FederalStudentAidPostsNewReportstoFSADataCenter.html
“Overall, DL borrowers enrolled in an alternative repayment plan have the highest [Active Repayment] delinquency rate of all repayment plans at more than 29 percent. This is a result of borrowers transitioning from the income-driven repayment plan, REPAYE, to an alternative repayment plan when they fail to recertify their income, which is a requirement of the REPAYE plan.”
Unlike IBR, IBR2014, and PAYE, which each have corresponding non-PFH subtypes, the concept of partial financial hardship is not part of the REPAYE plan’s design, so borrowers who “grow out” of the plan (via higher wages) or who do not recertify on-time end up moved into an alternative repayment plan type, rather than in “REPAYE non-PFH.”