Analyzing the Heightened Cash Monitoring Data Release

NOTE: This post was updated April 3 to reflect the Department of Education’s latest release of data on heightened cash monitoring.

In my previous post, I wrote about the U.S. Department of Education’s release of a list of 544 colleges subject to heightened cash monitoring standards due to various academic, financial, and administrative concerns. I constructed a dataset of the 512 U.S. colleges known to be facing heightened cash monitoring (HCM) along with two other key accountability measures: the percentage of students who default on loans within three years (cohort default rates) and an additional measure of private colleges’ financial strength (financial responsibility scores). In this post, I examine the reasons why colleges face heightened cash monitoring, as well as whether HCM correlates with the other accountability metrics.

The table below shows the number of colleges facing HCM-1 (shorter delays in ED’s disbursement of student financial aid dollars, although colleges not facing HCM have no delays) and HCM-2 (longer delays) by type of institution (public, private nonprofit, and for-profit).

Table 1: HCM status by institutional type.
Sector HCM-1 HCM-2
Public 68 6
Private nonprofit 97 18
Private for-profit 284 39
Total 449 63


While only six of 74 public colleges are facing HCM-2, more than one in ten private nonprofit (18 of 115) and for-profit colleges (39 of 323) are facing this higher standard of oversight. The next table shows the various reasons listed for why colleges are facing HCM.

Table 2: HCM status by reason for additional oversight.
Reason HCM-1 HCM-2
Low financial responsibility score 320 4
Financial statements late 66 9
Program review 1 21
Administrative capability 22 7
Accreditation concerns 1 12
Other 39 10


More than two-thirds (320) of the 449 colleges facing HCM-1 are included due to low financial responsibility scores (below a 1.5 on a scale ranging from -1 to 3), but only four colleges are facing HCM-2 for that reason. The next most common reason, affecting 75 colleges, is a delayed submission of required financial statements or audits. This affected 43 public colleges in Minnesota, which are a majority of the public colleges subject to HCM. Program review concerns were a main factor for HCM-2, with 21 colleges in this category (including many newly released institutions) facing HCM-2. Other serious concerns included administrative capability (22 in HCM-1 and 7 in HCM-2), accreditation (2 in HCM-1 and 12 in HCM-2), and a range of other factors (39 in HCM-1 and 10 in HCM-2).

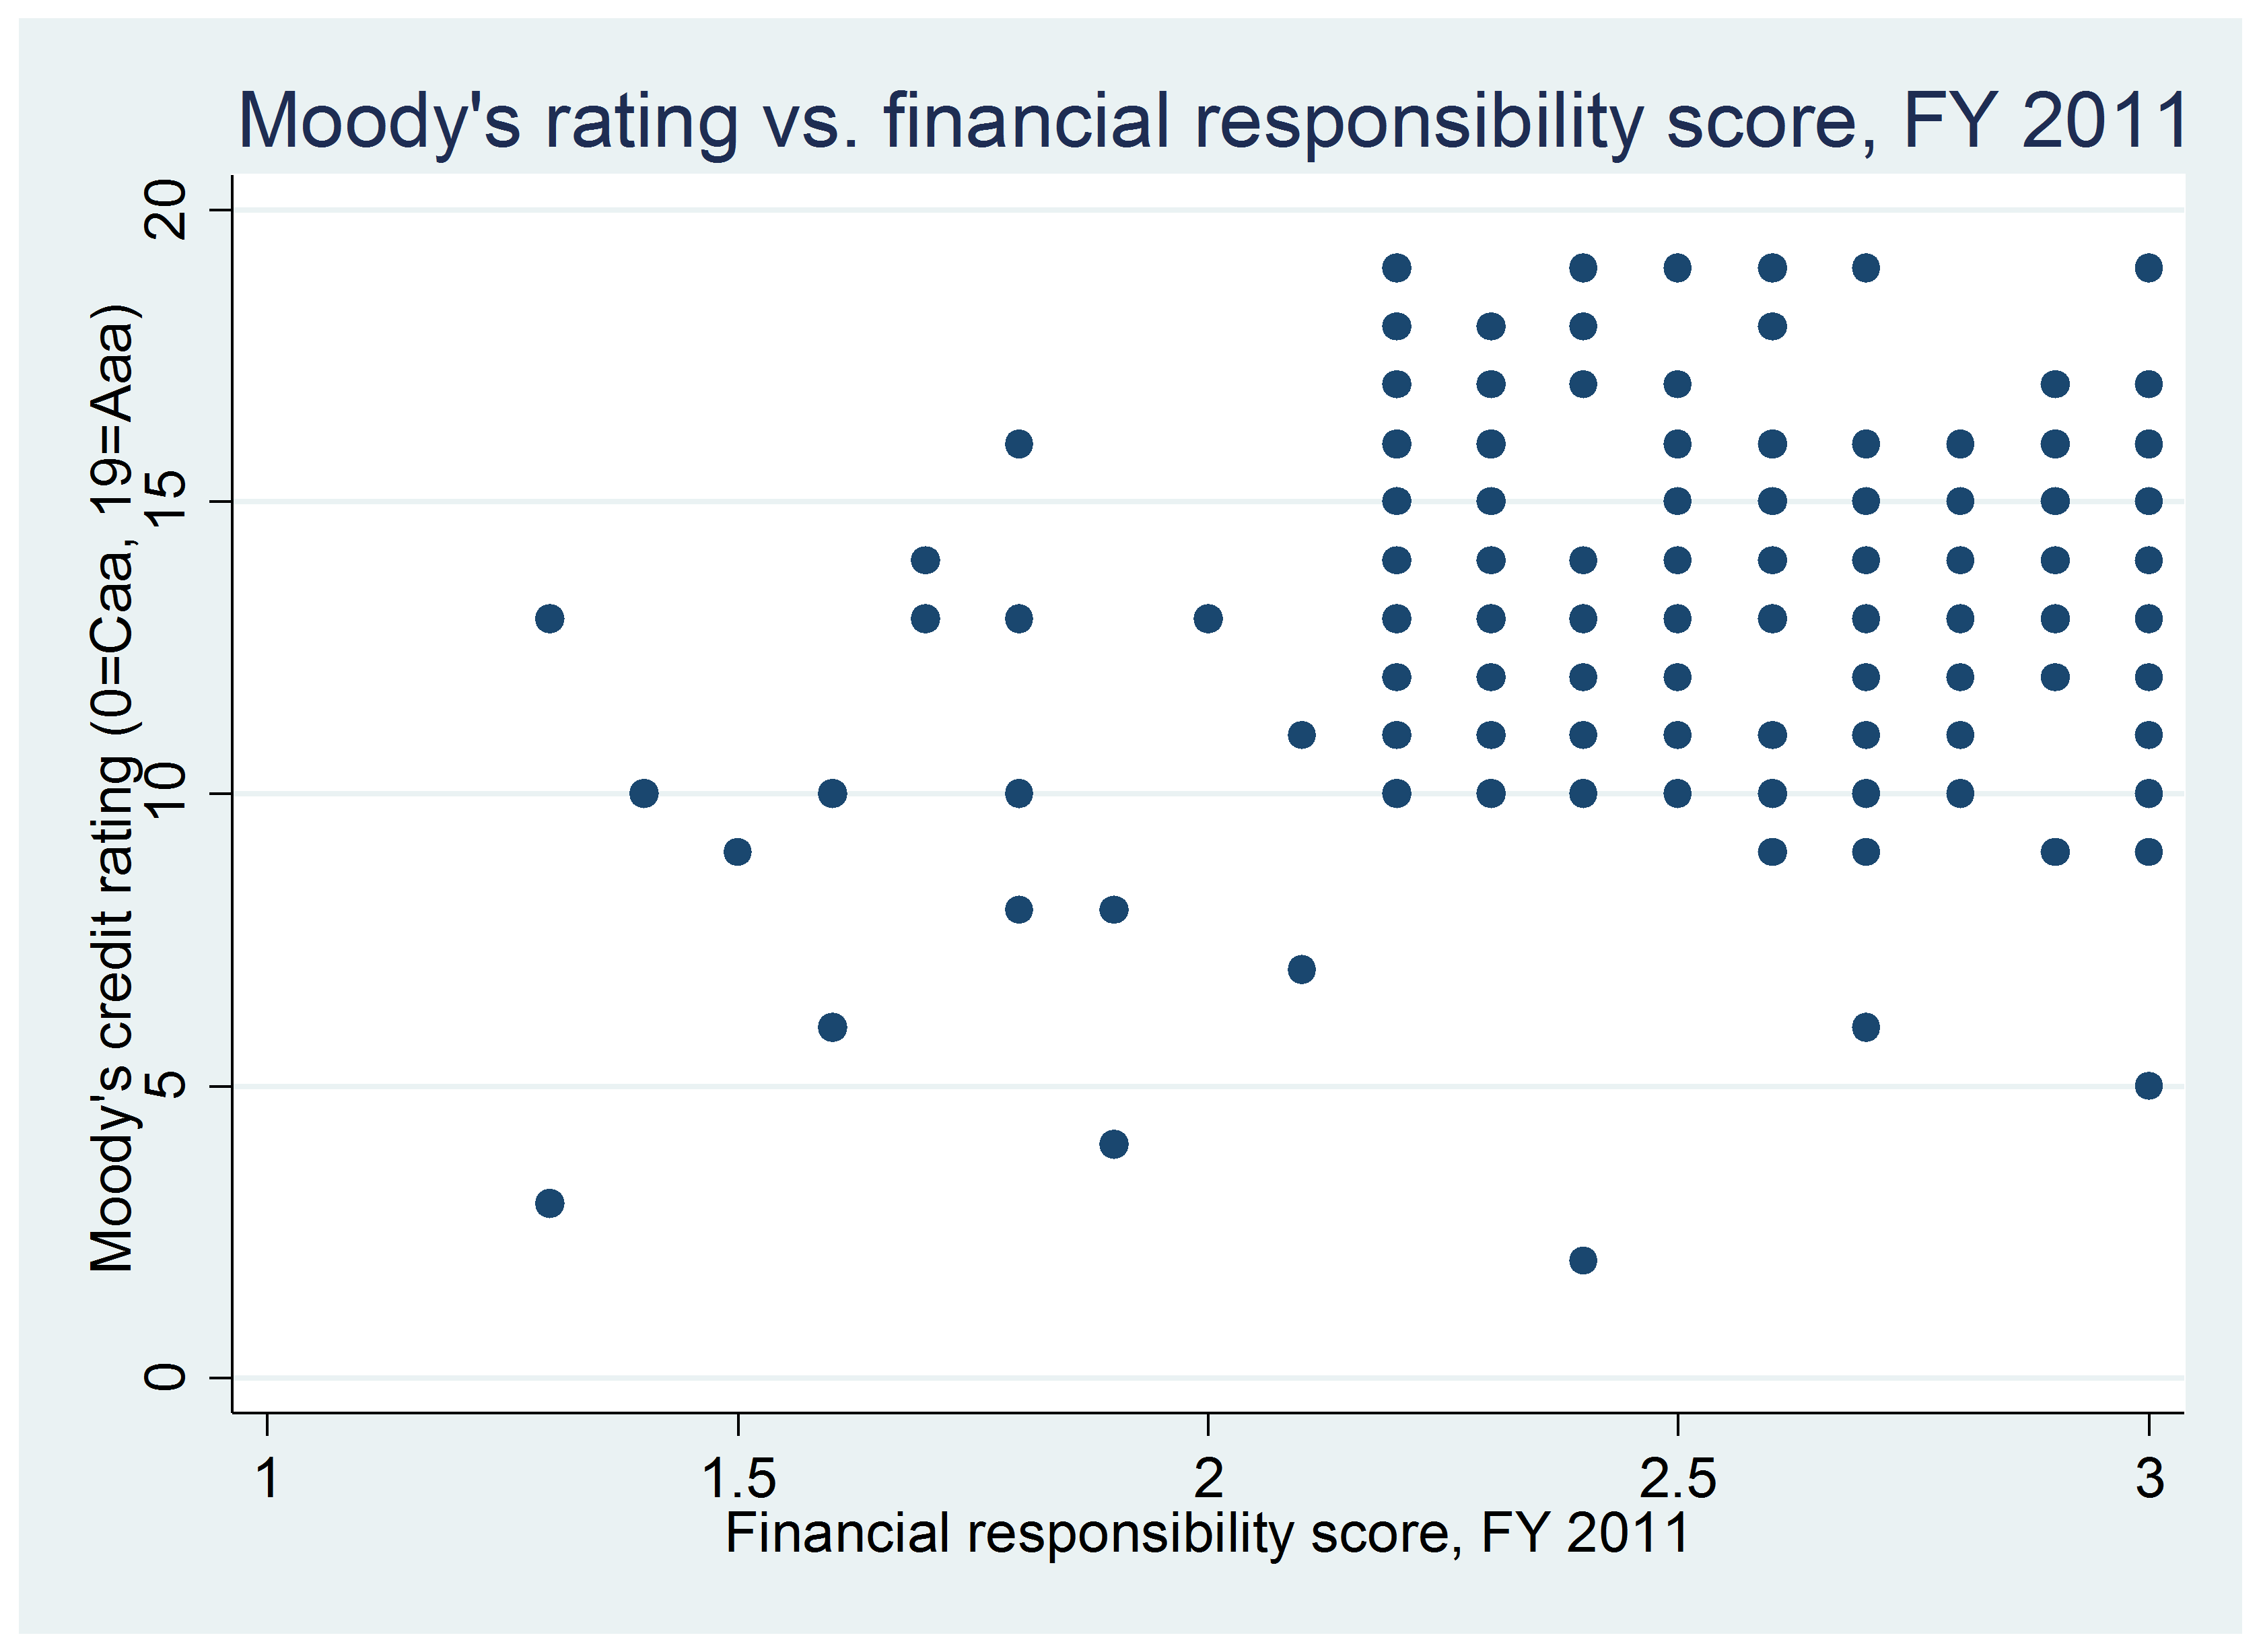
The next table includes three of the most common or serious reasons for facing HCM (low financial responsibility scores, administrative capacity concerns, and accreditation issues) and examines their median financial responsibility scores and cohort default rates.

Table 3: Median outcome values on other accountability metrics.
Reason for inclusion in HCM Financial responsibility score Cohort default rate
Low financial responsibility score 1.2 12.1%
Administrative capability 1.6 20.3%
Accreditation issues 2.0 2.8%


Not surprisingly, the typical college subject to HCM for a low financial responsibility score had a financial responsibility score of 1.2 in Fiscal Year 2012, which would require additional federal oversight. Although the median cohort default rate was 12.1%, which is slightly lower than the national default rate of 13.7%, some of these colleges do not participate in the federal student loan program and are thus counted as zeroes. The median college with administrative capability concerns barely passed the financial responsibility test (with a score of 1.6), while 20.3% of students defaulted. Colleges with accreditation issues (either academic or financial) had higher financial responsibility scores (2.0) and lower cohort default rates (2.8%).

What does this release of heightened cash monitoring data tell us? Since most colleges are on the list for known concerns (low financial responsibility scores or accreditation issues) or rather silly errors (forgetting to submit financial statements on time), the value is fairly limited. But there is still some value, particularly in the administrative capability category. These colleges deserve additional scrutiny, and the release of this list will do just that.

New Data on Heightened Cash Monitoring and Accountability Policies

Earlier this week, I wrote about the U.S. Department of Education’s pending release of a list of colleges that are currently subject to heightened cash monitoring requirements. On Tuesday morning, ED released the list of 556 colleges (updated to 544 on Friday), thanks to dogged reporting by Michael Stratford at Inside Higher Ed (see his take on the release here).

My interest lies in comparing the colleges facing heightened cash monitoring (HCM) to two other key accountability measures: the percentage of students who default on loans within three years (cohort default rates) and an additional measure of private colleges’ financial strength (financial responsibility scores). I have compiled a dataset with all of the domestic colleges known to be facing HCM, their cohort default rates, and their financial responsibility scores.

That dataset is available for download on my site, and I hope it is useful for those interested in examining these new data on federal accountability policies. I will have a follow-up post with a detailed analysis, but at this point it is more important for me to get the data out in a convenient form to researchers, policymakers, and the public.

DOWNLOAD the dataset here.

Why is it So Difficult to Sanction Colleges for Poor Performance?

The U.S. Department of Education has the ability to sanction colleges for poor performance in several ways. A few weeks ago, I wrote about ED’s most recent release of financial responsibility scores, which require colleges deemed financially unstable to post a bond with the federal government before receiving financial aid dollars. ED can also strip a college’s federal financial aid eligibility if too high of a percentage of students default on their federal loans, if data are not provided on key measures such as graduation rates, or if laws such as Title IX (prohibiting discrimination based on sex) are not followed.

The Department of Education can also sanction colleges by placing them on Heightened Cash Monitoring (HCM), requiring additional documentation and a hold on funds before student financial aid dollars are released. Corinthian Colleges, which partially collapsed last summer, blames suddenly imposed HCM requirements for its collapse as they were left short on cash. Notably, ED has the authority to determine which colleges should face HCM without relying upon a fixed and transparent formula.

In spite of the power of the HCM designation, ED has previously refused to release a list of which colleges are subject to HCM. The outstanding Michael Stratford at Inside Higher Ed tried to get the list for nearly a year through a Freedom of Information Act request (which was mainly denied due to concerns about hurting colleges’ market positions), finally making this dispute public in an article last week. This sunlight proved to be a powerful disinfectant, as ED relinquished late Friday and will publish a list of the names this week.

The concerns about releasing HCM scores is but one of many difficulties the Department of Education has had in sanctioning colleges for poor performance across different dimensions. Last fall, the cohort default rate measures were tweaked at the last minute, which had the effect of allowing more colleges to pass and retain access to federal aid. Financial responsibility scores have been challenged over concerns that ED’s calculations are incorrect. Gainful employment metrics are still tied up in court, and tying any federal aid dollars to college ratings appears to have no chance of passing Congress at this point. Notably, these sanctions are rarely due to direct concerns about academics, as academic matters are left to accreditors.

Why is it so difficult to sanction poorly-performing colleges, and why is the Department of Education so hesitant to release performance data? I suggest three reasons below, and I would love to hear your thoughts in the comments section.

(1) The first reason is the classic political science axiom of concentrated benefits (to colleges) and diffuse costs (to students and the general public). Since there is a college in every Congressional district (Andrew Kelly at AEI shows the median district had 11 colleges in 2011-12), colleges and their professional associations can put forth a fight whenever they feel threatened.

(2) Some of these accountability measures are either all-or-nothing in nature (such as default rates) or incredibly costly for financially struggling colleges (HCM or posting a letter of credit for a low financial responsibility score). More nuanced systems with a sliding scale might make some sanctions possible, and this is a possible reform under Higher Education Act reauthorization.

(3) The complex relationship between accrediting bodies and the Department of Education leaves ED unable to directly sanction colleges for poor academic performance. A 2014 GAO report suggested accrediting bodies also focus more on finances than academics and called for a greater federal role in accreditation, something that will not sit well with colleges.

I look forward to seeing the list of colleges facing Heightened Cash Monitoring be released later this week (please, not Friday afternoon!) and will share my thoughts on the list in a future piece.

Do Financial Responsibility Scores Reflect Colleges’ Financial Strength?

In spite of the vast majority of federal government operations being closed on Thursday due to snow (it’s been a rough end to winter in this part of the country), the U.S. Department of Education released financial responsibility scores for private nonprofit and for-profit colleges and universities based on 2012-2013 data. These scores are based on calculations designed to measure a college’s financial strength in three key areas: primary reserve ratio (liquidity), equity ratio (ability to borrow additional funds) and net income (profitability or excess revenue).

A college can score between -1 and 3, and colleges that score over 1.5 are considered financially responsible without any qualifications and can access federal funds. Colleges scoring between 1.0 and 1.4 are considered financially responsible and can access federal funds for up to three years, but are subject to additional Department of Education oversight of its financial aid programs. If a college does not improve its score within three years, it will not be considered financially responsible. Colleges scoring 0.9 or below are not considered financially responsible and must submit a letter of credit and be subject to additional oversight to get access to funds. A college can submit a letter of credit equal to 50% of all federal student aid funds received in the prior year and be deemed financially responsible, or it can submit a letter equal to 10% of all funds received and gain access to funds but still not be fully considered financially responsible.

As Goldie Blumenstyk (who knows more about the topic than any other journalist) and Joshua Hatch of The Chronicle of Higher Education discover in their snap analysis of the data, 158 private degree-granting colleges (108 nonprofit and 50 for-profit) failed to pass the test in 2012-13, down ten colleges from last year. Looking at all colleges eligible to receive federal financial aid, 192 failed outright in 2012-13 by scoring 0.9 or lower and an additional 128 faced additional oversight by scoring between 1.0 and 1.4.

But, as Blumenstyk and Hatch note in their piece, private colleges have repeatedly questioned how financial responsibility scores are determined and whether they are accurate measures of a college’s financial health. I’m working on an article examining whether and how colleges and other stakeholders respond to financial responsibility scores and therefore have a bunch of data at the ready to look at this topic.

Thanks to the help of my sharp research assistant Michelle Magno, I have a dataset of 270 private nonprofit colleges with financial responsibility scores and their Moody’s credit ratings in the 2010-11 academic year. (Colleges only have Moody’s ratings if they seek additional capital, which explains the smaller sample size and why few colleges with low financial responsibility scores are included.) The below scatterplot shows the relationship between Moody’s ratings and financial responsibility scores, with credit ratings observed between Caa and Aaa and financial responsibility scores observed between 1.3 and 3.0.

credit_rating

The correlation between the two measures of fiscal health was just 0.038, which is not significantly different from zero. Of the 57 colleges with the maximum financial responsibility score of 3.0, only three colleges (Northwestern, Stanford, and Swarthmore) had the highest possible credit rating of Aaa. Twenty-five colleges with financial responsibility scores of 3.0 had credit ratings of Baa, seven to nine grades lower than Aaa. On the other hand, six of the 15 colleges with Aaa credit ratings (including Harvard and Yale) had financial responsibility scores of 2.2, well below the maximum possible score.

This suggests that the federal government and private credit agencies measure colleges’ financial health in different ways—at least among colleges with the ability to access credit. Financial responsibility scores can certainly have the potential to affect how colleges structure their finances, but it is unclear whether they accurately reflect a college’s ability to operate going forward.

How Many Students Pay Full Price at Private Colleges?

As private nonprofit colleges in many regions of the country struggle to recruit an incoming class that meets both enrollment and revenue goals, the percentage of students paying the full sticker price has decreased significantly. This is well-explained in Jeff Selingo’s piece in the Washington Post, for which I contributed some analyses. In this blog post, I provide a few additional details behind the numbers.

I used data from the National Postsecondary Student Aid Study, a nationally representative survey of undergraduate students conducted every four years. For this analysis, I pulled data from the 1999-2000 and 2011-12 waves to look at trends in the percentage of students receiving any grant aid. (The remainder of the students are paying full price.) I cut the data by institutional selectivity, as conventional wisdom is that less-selective institutions are struggling more than elite colleges.

Percent of students at private 4-year colleges receiving any grant aid (NPSAS).
Selectivity category 1999-2000 (pct) 2011-2012 (pct)
Overall 66.8 76.3
Very selective 60.6 72.2
Moderately selective 71.6 83.6
Minimally selective 63.4 71.3
Open admission 62.2 63.8


While the percentage of students receiving grant aid increased in all categories of colleges but open admission institutions, the percentage with grant aid and the growth over time was largest at moderately selective institutions. These colleges and universities are squeezed financially, as they compete with very selective colleges for some students while being forced to fend off less selective colleges that are offering some of their students larger aid packages. As a result, yield rates (the percent of students accepted to a college who actually attend) have dropped to 15% at some of these institutions.

The increased competition for students and reduced ability of families to pay full price are key reasons why Standard & Poor’s just issued a negative outlook for the creditworthiness of nonprofit higher education for 2015. The big question remains how long some colleges can afford to continue operating under current business models.

How to Calculate–and Not Calculate–Net Prices

Colleges’ net prices, which the U.S. Department of Education defines as the total cost of attendance (tuition and fees, room and board, books and supplies, and other living expenses) less all grant and scholarship aid, have received a lot of attention in the last few years. All colleges are required by the Higher Education Opportunity Act to have a net price calculator on their website, where students can get an estimate of their net price by inputting financial and academic information. Net prices are also used for accountability purposes, including in the Washington Monthly college rankings that I compile, and are likely to be included in the Obama Administration’s Postsecondary Institution Ratings System (PIRS) that could be released in the next several weeks.

Two recently released reports have looked at the net price of attendance, but only one of them is useful to either researchers or families considering colleges. A new Brookings working paper by Phillip Levine makes a good contribution to the net price discussion by making a case for using the median net price (instead of the average) for both consumer information and accountability purposes. He uses data from Wellesley College’s net price calculator to show that the median low-income student faces a net price well below the listed average net price. The reason why the average is higher than the median at Wellesley is because a small number of low-income students pay a high net price, while a much larger number of students pay a relatively low price. The outlying values for a small number of students bring up the average value.

I used data from the 2011-12 National Postsecondary Student Aid Study, a nationally-representative sample of undergraduate students, to compare the average and median net prices for dependent and independent students by family income quartile. The results are below:

Comparing average and median net prices by family income quartile.
Average 10th %ile 25th %ile Median 75th %ile 90th %ile
Dependent students: Parents’ income ($1,000s)
<30 10,299 2,500 4,392 8,113 13,688 20,734
30-64 13,130 3,699 6,328 11,077 17,708 24,750
65-105 16,404 4,383 8,178 14,419 21,839 30,174
106+ 20,388 4,753 9,860 18,420 27,122 39,656
Independent students: student and spouse’s income ($1,000s)
<7 10,972 3,238 5,000 8,889 14,385 22,219
7-19 11,114 3,475 5,252 9,068 14,721 22,320
20-41 10,823 3,426 4,713 8,744 14,362 21,996
42+ 10,193 3,196 4,475 7,931 13,557 20,795
SOURCE: National Postsecondary Student Aid Study 2011-12.


Across all family income quartiles for both dependent and independent students, the average net price is higher than the median net price. About 60% of students pay a net price at or below the average net price reported to IPEDS, suggesting that switching to reporting the median net price might improve the quality of available information.

The second report was the annual Trends in College Pricing report, published by the College Board. The conclusion the report reached was that net prices are modest and have actually decreased several years during the last decade. However, their definition of “net price” suffers from two fatal flaws:

(1) “Net price” doesn’t include all cost of attendance components. They publicize a “net tuition” measure and a “net tuition, fees, room and board” measure, but the cost of attendance also includes books and supplies as well as other living expenses such as transportation, personal care, and a small entertainment allowance. (For more on living costs, see this new working paper on living costs I’ve got out with Braden Hosch of Stony Brook and Sara Goldrick-Rab of Wisconsin.) This understates what students and their families should actually expect to pay for college, although living costs can vary across individuals.

(2) Tax credits are included with grant aid in their “net price” definition. Students and their families do not receive the tax credit until they file their taxes in the following year, meaning that costs incurred in August may be partially reimbursed the following spring. That does little to help families pay for college upfront, when the money is actually needed. Additionally, not all families that qualify for education tax credits actually claim them. In this New America Foundation blog post, Stephen Burd notes that about 25% of families don’t claim tax credits—and this takeup rate is likely lower among lower-income families.

Sadly, the College Board report has gotten a lot of attention in spite of its inaccurate net price definitions. I would like to see a robust discussion about the important Brookings paper and how we can work to improve net price data—with the correct definition used.

Gainful Employment and the Federal Ability to Sanction Colleges

The U.S. Department of Education’s second attempt at “gainful employment” regulations, which apply to the majority of vocationally-oriented programs at for-profit colleges and certain nondegree programs at public and private nonprofit colleges, was released to the public this morning. The Department’s first effort in 2010 was struck down by a federal judge after the for-profit sector challenged a loan repayment rate metric on account of it requiring additional student data collection that would be illegal under current federal law.

The 2014 measure was widely expected to contain two components: a debt-to-earning s ratio that required program completers to have annual loan debt be less than 8% of total income or 20% of “discretionary income” above 150% of the poverty line, and a cohort default rate measure that required fewer than 30% of program borrowers (regardless of completion status) to default on federal loans in less than three years. As excellent articles on the newly released measure in The Chronicle of Higher Education and Inside Higher Ed this morning detail, the cohort default rate measure was unexpectedly dropped from the final regulation. This change in rules, Inside Higher Ed reports, would reduce the number of affected programs from 1,900 to 1,400 and the number of affected students from about one million to 840,000.

There will be a number of analyses of the exact details of gainful employment over the coming days (I highly recommend anything written by Ben Miller at the New America Foundation), but I want to briefly discuss on what the changes to the gainful employment rule mean for other federal accountability policies. Just over a month ago, the Department of Education released cohort default rate data, but they tweaked a calculation at the last minute that had the effect of allowing more colleges to get under the 30% default rate threshold at least once in three years to avoid sanctions.

The last-minute changes to both gainful employment and cohort default rate accountability measures highlight the political difficulty of the current sanctioning system, which is on an all-or-nothing basis. When the only funding lever the federal government uses is so crude, colleges have a strong incentive to lobby against rules that could effectively shut them down. It is long past time for the Department of Education to consider sliding sanctions against colleges with less-than-desirable outcomes if the goal is to eventually cut off financial aid to the poorest performing institutions.

Finally, the successful lobbying efforts of different sectors of higher education make it appear less likely that the Obama Administration’s still-forthcoming Postsecondary Institution Ratings System (PIRS) will be able to tie financial aid to college ratings. This measure still requires Congressional approval, but the Department of Education’s willingness to propose sanctions has been substantially weakened over the last month. It remains to be seen if the Department of Education under the current administration will propose how PIRS will be tied to aid before the clock runs out on the Obama presidency.

Do Student Loans Result in Tuition Increases? Why It’s So Hard to Tell

One of the longstanding questions in higher education finance is whether access to federal financial aid dollars is one of the factors behind tuition increases. This was famously stated by Education Secretary William Bennett in a 1987 New York Times editorial:

“If anything, increases in financial aid in recent years have enabled colleges and universities blithely to raise their tuitions, confident that Federal loan subsidies would help cushion the increase. In 1978, subsidies became available to a greatly expanded number of students. In 1980, college tuitions began rising year after year at a rate that exceeded inflation. Federal student aid policies do not cause college price inflation, but there is little doubt that they help make it possible.”

Since Secretary Bennett made his statement (now called the Bennett Hypothesis), more students are receiving federal financial aid. In 1987-1988, the average full-time equivalent student received $2,414 in federal loans, which rose to $6,374 in 2012-2013. The federal government has also increased spending on Pell Grants during this period, although the purchasing power of the grant has eroded due to large increases in tuition.

The Bennett Hypothesis continues to be popular in certain circles, as illustrated by comments by Dallas Mavericks owner and technology magnate Mark Cuban. In 2012, he wrote:

“The point of the numbers is that getting a student loan is easy. Too easy.

You know who knows that the money is easy better than anyone ? The schools that are taking that student loan money in tuition. Which is exactly why they have no problems raising costs for tuition each and every year.

Why wouldn’t they act in the same manner as real estate agents acted during the housing bubble? Raise prices and easy money will be there to pay your price. Good business, right ? Until its not.”

Recently, Cuban called for limiting student loans to $10,000 per year, as reported by Inc.:

“If Mark Cuban is running the economy, I’d go and say, ‘Sallie Mae, the maximum amount that you’re allowed to guarantee for any student in a year is $10,000, period, end of story.’  

We can talk about Republican or Democratic approaches to the economy but until you fix the student loan bubble–and that’s where the real bubble is–we don’t have a chance. All this other stuff is shuffling deck chairs on the Titanic.”

Cuban’s plan wouldn’t actually affect the vast majority of undergraduate students, as loan limits are often below $10,000 per year. Dependent students are limited to no more than $7,500 per year in subsidized and unsubsidized loans and independent students are capped at $12,500 per year. But this would affect graduate students, who can borrow $20,500 per year in unsubsidized loans, as well as students and their families taking out PLUS loans, which are only capped by the cost of attendance.

Other commentators do not believe in the Bennett Hypothesis. An example of this is from David Warren, president of the National Association of Independent Colleges and Universities (the professional association for private nonprofit colleges). In 2012, he wrote that “the hypothesis is nothing more than an urban legend,” citing federal studies that did not find a relationship.

The research on the Bennett Hypothesis can best be classified as mixed, with some studies finding a modest causal relationship between federal financial aid and tuition increases and others finding no relationship. (See this Wonkblog piece for a short overview or Donald Heller’s monograph for a more technical treatment.) But for data reasons, the studies of the Bennett Hypothesis either focus on all financial aid lumped together (which is broader than the original hypothesis) or just Pell Grants.

So do student loans result in tuition increases? There is certainly a correlation between federal financial aid availability and college tuition, but the first rule of empirical research is that correlation does not imply causation. And establishing causality is extremely difficult given the near-universal nature of student loans and the lack of change in program rules over time. It is essential to have some change in the program in order to identify effects separate from other types of financial aid.

In an ideal world (from a researcher’s perspective), some colleges would be randomly assigned to have lower loan limits than others and then longer-term trends in tuition could be examined. That, of course, is politically difficult to do. Another methodological possibility would be to look at the colleges that do not participate in federal student loan programs, which are concentrated among community colleges in several states. But the low tuition charges and low borrowing rates at community colleges make it difficult to even postulate that student loans could potentially drive tuition increases at community colleges.

A potential natural experiment (in which a change is introduced to a system unexpectedly) could have been the short-lived credit tightening of parent PLUS loans, which hit some historically black colleges hard. Students who could no longer borrow the full cost of attendance had to scramble to find other funding, which put pressure on colleges to find additional money for students. But the credit changes have partially been reversed before colleges had to make long-term decisions about pricing.

I’m not too concerned about student loans driving tuition increases at the vast majority of institutions. I think the Bennett Hypothesis is likely the strongest (meaning a modest relationship between loans and tuition) at the most selective undergraduate institutions and most graduate programs, as loan amounts can be substantial and access to credit is typically good. But, without a way to identify variations in loan availability across similar institutions, that will remain a postulation.

[NOTE (7/7/15): Since this piece was initially posted, more research has come out on the topic. See this updated blog post for my most up-to-date take.

Analyzing the New Cohort Default Rate Data

The U.S. Department of Education today released cohort default rates (CDR) by college, which reflects the percentage of students who default on their loans within three years of entering repayment. This is a big deal for colleges, as any college that had a CDR of more than 30% for three consecutive years could lose its federal financial aid eligibility. I analyzed what we can learn from CDRs—a limited amount—in a blog post earlier this week.

And then things got interesting in Washington. The Department of Education put out a release yesterday noting that some students with loans from multiple servicers (known as “split servicers”) were current on some loans and defaulting on others. In this release, ED noted that the split servicer students were being dropped from CDRs over the last three years—but only if a college was close to the eligibility threshold. This led many to question whether ED was serious about using CDRs as an accountability tool, as well as trying to glean implications for the upcoming college ratings system.

The summary data for cohort default rates by year and sector is available here, and shows a decline from a 14.7% default rate in Fiscal Year 2010 to 13.7% in FY 2011. Default rates in each major sector of higher education also fell, led by a decline from 21.8% to 19.1% in the for-profit sector. However, a comparison of the FY 2009 and 2010 data in this release with the FY 2009 and 2010 data in last year’s release shows no changes from last year–before the split servicer change was adopted. Something doesn’t seem to be right there.

Twenty-one colleges are subject to sanctions under the new CDRs, all but one of which (Ventura Adult and Continuing Education) are for-profit. Most of the colleges subject to sanctions are small beauty or cosmetology institutions and reflect a very small percentage of total enrollment. We don’t know how many other colleges would have crossed over 30%, if not for the split servicer changes.

This year’s data show some very fortunate colleges. Among colleges with a sufficiently high participation rate, six institutions had CDRs of between 29 and 29.9 percent after being over 30% in the previous two years. They are led by Paris Junior College, with a 29.9% CDR in FY 2011 after being over 40% in the previous years. Other colleges weren’t so lucky. For example, the Aviation Institute of Maintenance was at 38.9% in FY 2009, 36.1% in FY 2010, and improved to 31.1% to 2011—but is still subject to sanctions.

FY 2011 CDRs, FY 2009 & 2010 above 30%
Name FY 2011 FY 2010 FY 2009
SEARCY BEAUTY COLLEGE 9.3 30.7 38.2
NEW CONCEPT MASSAGE AND BEAUTY SCHOOL 9.7 30.1 35.2
UNIVERSITY OF ANTELOPE VALLEY 12 31.8 30.6
PAUL MITCHELL THE SCHOOL ESCANABA 12.1 40 68.7
SAFFORD COLLEGE OF BEAUTY CULTURE 13.1 36.8 36.3
COMMUNITY CHRISTIAN COLLEGE 13.9 33.3 38.8
UNIVERSITY OF SOUTHERNMOST FLORIDA 14.6 30.8 35.1
SOUTHWEST UNIVERSITY AT EL PASO 15.5 36.1 37.5
CENTRO DE ESTUDIOS MULTIDISCIPLINARIOS 15.6 39.2 50.9
VALLEY COLLEGE 17.2 36.9 32.7
AMERICAN BROADCASTING SCHOOL 17.5 30.8 44.6
SUMMIT COLLEGE 17.6 30.9 30.5
VALLEY COLLEGE 19.4 56.5 37.5
AMERICAN UNIVERSITY OF PUERTO RICO 21 31.2 36.6
BRYAN UNIVERSITY 21.1 30.2 30.4
SOUTH CENTRAL CAREER CENTER 22 32.6 35.1
PAUL MITCHELL THE SCHOOL ARKANSAS 22 37.5 30
D-JAY’S SCHOOL OF BEAUTY, ARTS & SCIENCES 22.2 37.5 41.9
PAUL MITCHELL THE SCHOOL GREAT LAKES 22.2 34.6 33.9
KILGORE COLLEGE 22.7 30.2 33.5
ANTONELLI COLLEGE 22.8 33 35.1
OLD TOWN BARBER COLLEGE 23 37.7 40
OZARKA COLLEGE 23.1 41.8 35
TESST COLLEGE OF TECHNOLOGY 23.4 33.7 32
CENTURA COLLEGE 23.7 32 35
RUST COLLEGE 23.7 32 31.6
CARSON CITY BEAUTY ACADEMY 23.8 31.8 43.3
BACONE COLLEGE 24.1 32 30
KAPLAN CAREER INSTITUTE 24.1 32.5 33.6
TECHNICAL CAREER INSTITUTES 24.3 38.8 34.9
VICTOR VALLEY COMMUNITY COLLEGE 24.6 32.6 31
SOUTHWESTERN CHRISTIAN COLLEGE 24.6 32.7 43.1
AMERICAN BEAUTY ACADEMY 24.8 35.7 34.6
CENTURA COLLEGE 24.8 31.5 34.7
DENMARK TECHNICAL COLLEGE 25 30.8 31.6
MILAN INSTITUTE OF COSMETOLOGY 25 32.4 41.5
TREND BARBER COLLEGE 25 43.5 60.5
JACKSONVILLE BEAUTY INSTITUTE 25.2 33.3 41.7
CONCEPT COLLEGE OF COSMETOLOGY 25.3 41.5 34.2
EASTERN OKLAHOMA STATE COLLEGE 25.4 31.8 30
OTERO JUNIOR COLLEGE 25.5 34.2 38.2
LANGSTON UNIVERSITY 25.5 32.5 32.9
COLLEGEAMERICA DENVER 25.5 34.8 38.3
AVIATION INSTITUTE OF MAINTENANCE 25.8 36.9 39.6
EMPLOYMENT SOLUTIONS 26 38.5 30
SANFORD-BROWN COLLEGE 26.2 31.6 31.5
CAMBRIDGE INSTITUTE OF ALLIED HEALTH AND TECHNOLOGY 26.6 33.3 35
ANTELOPE VALLEY COLLEGE 26.9 32.6 33.2
UNIVERSITY OF ARKANSAS COMMUNITY COLLEGE AT BATESVILLE 26.9 30.6 31.6
CC’S COSMETOLOGY COLLEGE 27.4 40.3 35.9
MILWAUKEE CAREER COLLEGE 27.6 34.1 32.7
NTMA TRAINING CENTERS OF SOUTHERN CALIFORNIA 27.8 32.1 34.2
CONCORDIA COLLEGE ALABAMA 27.9 31.4 37.5
NORTH AMERICAN TRADE SCHOOLS 28 31 31.1
AVIATION INSTITUTE OF MAINTENANCE 28.1 37.9 39.8
MEDIATECH INSTITUTE 28.4 33.3 33.3
SEBRING CAREER SCHOOLS 29 54.1 57.5
MOHAVE COMMUNITY COLLEGE 29.3 32.7 36.7
CHERYL FELL’S SCHOOL OF BUSINESS 29.4 38 31.2
AVIATION INSTITUTE OF MAINTENANCE 29.4 36.1 38.9
KLAMATH COMMUNITY COLLEGE 29.4 33 31.7
PARIS JUNIOR COLLEGE 29.9 40.7 41.5
STYLEMASTERS COLLEGE OF HAIR DESIGN 30.6 46.6 37
LASSEN COLLEGE 30.8 37.1 37.7
AVIATION INSTITUTE OF MAINTENANCE 31.1 37.5 32.2
CHARLESTON SCHOOL OF BEAUTY CULTURE 31.7 37.5 34
PALLADIUM TECHNICAL ACADEMY 33 39.4 46.2
L T INTERNATIONAL BEAUTY SCHOOL 38.1 37.7 38
TIDEWATER TECH 38.6 42.7 55
JAY’S TECHNICAL INSTITUTE 40.6 53.8 51.5
OHIO STATE COLLEGE OF BARBER STYLING 41.1 37.8 32.9
MEMPHIS INSTITUTE OF BARBERING 44.7 47.2 44.4
FLORIDA BARBER ACADEMY 46.5 41.7 32.5
SAN DIEGO COLLEGE 49.3 34 35.7

Fully 35 colleges with sufficient participation rates had CDRs between 29.0% and 29.9% in FY 2011, including a mix of small for-profit colleges, HBCUs, and community colleges. The University of Arkansas-Pine Bluff, a designated minority-serving institution, has had CDRs of 29.9%, 29.2%, and 29.8% in the last three years. Mt. San Jacinto College and Harris-Stowe State University also had CDRs just under 30% in each of the last three years. Only 19 colleges, representing a mix of institutional types, had CDRs between 30.0% and 30.9%. This includes Murray State College in Oklahoma, which was at 30.0% in FY 2011, 28.9% in FY 2010, and 31.1% in FY 2009. Forty-three colleges were between 28.0% and 28.9%.

FY 2011 CDRs between 29 and 31 percent
Name FY 2011 FY 2010 FY 2009
OHIO TECHNICAL COLLEGE 29 24.1 21.3
DAYMAR COLLEGE 29 28.9 46.2
SEBRING CAREER SCHOOLS 29 54.1 57.5
L’ESPRIT ACADEMY 29.1 0 0
BLACK RIVER TECHNICAL COLLEGE 29.1 27.9 26.6
NEW SCHOOL OF RADIO & TELEVISION 29.1 26.2 28.1
LOUISBURG COLLEGE 29.2 28.7 24.7
MOHAVE COMMUNITY COLLEGE 29.3 32.7 36.7
HARRIS SCHOOL OF BUSINESS 29.3 25.6 17.8
INTELLITEC MEDICAL INSTITUTE 29.3 27.1 24.7
GALLIPOLIS CAREER COLLEGE 29.3 33.9 29.4
CHERYL FELL’S SCHOOL OF BUSINESS 29.4 38 31.2
COLLEGE OF THE SISKIYOUS 29.4 27.7 27.1
AVIATION INSTITUTE OF MAINTENANCE 29.4 36.1 38.9
KLAMATH COMMUNITY COLLEGE 29.4 33 31.7
COLORLAB ACADEMY OF HAIR, THE 29.4 24.3 12.5
DIGRIGOLI SCHOOL OF COSMETOLOGY 29.4 21.6 23.5
VIRGINIA SCHOOL OF MASSAGE 29.4 14.8 22
WASHINGTON COUNTY COMMUNITY COLLEGE 29.5 20.5 12.7
MT. SAN JACINTO COLLEGE 29.5 29.9 26.5
WEST TENNESSEE BUSINESS COLLEGE 29.5 32.6 21.8
BRITTANY BEAUTY SCHOOL 29.5 31.9 26.4
JOHN PAOLO’S XTREME BEAUTY INSTITUTE, GOLDWELL PRODUCTS ARTISTRY 29.5 25 0
HARRIS – STOWE STATE UNIVERSITY 29.6 27.9 26.5
CARIBBEAN UNIVERSITY 29.6 29.9 29.9
GUILFORD TECHNICAL COMMUNITY COLLEGE 29.7 26 19
WARREN COUNTY CAREER CENTER 29.7 22.9 25
STARK STATE COLLEGE 29.7 24.5 17.2
STRAND COLLEGE OF HAIR DESIGN 29.7 17.9 11.1
INDEPENDENCE COLLEGE OF COSMETOLOGY 29.8 21.6 18.4
FRANK PHILLIPS COLLEGE 29.8 25.2 29.1
MEDICAL ARTS SCHOOL (THE) 29.8 21.6 13.1
NEW MEXICO JUNIOR COLLEGE 29.8 24.1 23.1
PARIS JUNIOR COLLEGE 29.9 40.7 41.5
UNIVERSITY OF ARKANSAS AT PINE BLUFF 29.9 29.2 29.8
MURRAY STATE COLLEGE 30 28.9 31.1
JARVIS CHRISTIAN COLLEGE 30 36.5 29.3
BUSINESS INDUSTRIAL RESOURCES 30.1 19.1 20.9
LONG BEACH CITY COLLEGE 30.1 24.2 19
EASTERN GATEWAY COMMUNITY COLLEGE 30.1 0 0
MARTIN UNIVERSITY 30.2 19.8 18.7
LANE COMMUNITY COLLEGE 30.2 30.6 19.5
CAREER QUEST LEARNING CENTER 30.2 24.1 16.1
NIGHTINGALE COLLEGE 30.3 25 16.6
EMPIRE BEAUTY SCHOOL 30.4 31.6 25.2
NATIONAL ACADEMY OF BEAUTY ARTS 30.4 20.6 5.6
BAR PALMA BEAUTY CAREERS ACADEMY 30.5 35.8 26.8
WEST VIRGINIA UNIVERSITY – PARKERSBURG 30.5 25.8 24.1
ENSACOLA SCHOOL OF MASSAGE THERAPY & HEALTH CAREERS 30.5 17.3 10
PROFESSIONAL MASSAGE TRAINING CENTER 30.6 14.8 13
UNIVERSAL THERAPEUTIC MASSAGE INSTITUTE 30.6 23.5 17.2
STYLEMASTERS COLLEGE OF HAIR DESIGN 30.6 46.6 37
CCI TRAINING CENTER 30.8 26.5 26.7
INSTITUTE OF AUDIO RESEARCH 30.8 29.7 17
LASSEN COLLEGE 30.8 37.1 37.7
KAPLAN CAREER INSTITUTE 30.8 34.6 29.7
TRANSFORMED BARBER AND COSMETOLOGY ACADEMY 30.9 66.6 0
MAYSVILLE COMMUNITY AND TECHNICAL COLLEGE 30.9 26.4 24.5
TRI-COUNTY TECHNICAL COLLEGE 30.9 27.2 16.1

Some of the larger for-profits fared better, potentially due to split servicers. The University of Phoenix’s CDR was 19.0% in FY 2011, down from 26.0% in FY 2010 and 26.4%. DeVry University was at 18.5% in FY 2011, down from 23.4% in FY 2010 and 24.1% in FY 2009. ITT Technical Institute also improved, going from 33.3% in FY 2009 to 28.6% and then 22.4% this year. (Everest College disaggregates its data by campus, but the results are similar.)

The CDR data are not without controversy, but they are an important accountability tool going forward. It will be interesting to see whether and how these data will be used in the draft Postsecondary Institution Ratings System later this fall.

What Are Cohort Default Rates Good For?

Today marks the start of U.S. Department of Education’s annual release of cohort default rates (CDR), which reflects the percentage of students who default on their loans within three years of entering repayment. Colleges were informed of their rates today, with a release to the public coming sometime soon. This release, tracking students who entered repayment in Fiscal Year 2011, will the third year that three-year CDRs have been collected and completes a shift from two-year to three-year CDRs for accountability purposes.

Before this year, colleges were subject to sanctions based on their two-year CDRs. Any college that had a two-year CDR of more than 40% in one year could lose its federal student loan eligibility, while any college with a two-year CDR of over 25% for three consecutive years could lose all federal financial aid eligibility. (Colleges with a very small percentage of borrowers can get an exemption.) While this was a rare occurrence (fewer than ten colleges were impacted last year), the switch to a three-year CDR has worried colleges even as the allowed CDR over three years rose from 25% to 30%.

But as the methodology changes, we need to consider what CDR data are actually good for. Colleges take cohort default rates very seriously, and the federal government is likely to use default rates as a component of the often-discussed (and frequently delayed) Postsecondary Institution Ratings System (PIRS). But should the higher education community, policymakers, or the general public take CDRs seriously? Below are some reasons why the default data are far from complete.

(1) Students are tracked over only three years, and income-based repayment makes the data less valuable. I have previously written about these two issues—and why it’s absurd that the Department of Education doesn’t track students over at least ten years. Income-based repayment means that students can be current on their payments even if their payments are zero, which is good for the student but isn’t exactly a ringing endorsement of a given college’s quality.

(2) Individual campuses are often aggregated to the system level, but this isn’t consistent. One of the biggest challenges as a researcher in higher education finance is that data on loan and grant volumes and student loan default rates come from Federal Student Aid instead of the National Center for Education Statistics. This may sound trivial, but some colleges aggregate FSA data to the system level for reporting purposes while all NCES data are at the campus level. This means that while default data on individual campuses within the University of Wisconsin System are available, data from all of the Penn State campuses are aggregated. Most for-profit systems also aggregate data, likely obscuring some individual branches that would otherwise face sanctions.

(3) Defaults are far from the only adverse outcome, but it’s the only one with reported data. Students are not counted as being in default until no payment has been made for at least 271 days, but we have no idea of delinquency rates, hardship deferments, or forbearances related to financial problems by campus. As I recently wrote in a guest post for Access to Completion, the percentage of students having repayment difficulties ranges between 17% and 51%, depending on assumptions made. But we don’t have data on delinquency rates by campus, something which a lot of stakeholders would have interest in.

Does this mean cohort default rates are good for absolutely nothing? No. They’re still useful in identifying colleges (or systems) where a large percentage of borrowers default quickly and a substantial percentage of students borrow. And very low default rates can be a sign that either students are doing well in the labor market after leaving college or that they have the knowledge to enter income-based repayment programs. But for many colleges with middling default rates, far more data are needed (that the Department of Education collects and doesn’t release) to get a better picture of performance.

When the CDR data come out, I’ll have part 2 of this post—focusing on the colleges that are subject to sanctions and what that means for current and future accountability systems.