To Reduce Debt, Give Students More Information to Make Wise College Choice Decisions

This article was originally published at The Conversation.

Higher education has gotten a lot of attention during the early stages of the 2016 presidential campaign. All three major candidates for the Democratic nomination – former New York Senator Hillary Clinton, former Maryland Governor Martin O’Malley and Vermont Senator Bernie Sanders – have proposed different plans to reduce or eliminate student loan debt at public colleges.

However, the price tags of these plans (at least $350 billion over 10 years for Clinton’s proposal) will make free college highly unlikely. Republicans, including leading presidential candidates, have already made their opposition quite clear.

But student loan debt is unlikely to go away anytime soon. What is important for now is that students and their families get better information about tuition costs and college outcomes so they can make more informed decisions, especially as the investments are so large.

What colleges will reveal

Although colleges are required to submit data on hundreds of items to the federal government each year, only a few measures that are currently available are important to most students and their families:

First, colleges must report graduation rates for first-time, full-time students. This does a good job reflecting the outcomes at selective colleges, where most students go full-time.

But full-time students make up only a small percentage of students at some colleges, and data on the graduation rates of part-time students will not be available until 2017.

The price tag of Hillary Clinton’s college plan is too steep.
Marc Nozell, CC BY

Colleges must also report net prices (the cost of attendance less all grant aid received) by different family income brackets. The cost of attendance (defined as tuition and fees, room and board, books and supplies, and other living expenses such as transportation and laundry) and the resulting net price are important measures of affordability.

Because financial aid packages can vary across colleges with similar sticker prices, net prices are important to give students an idea of what they might expect to pay.

Colleges that offer their students federal loans must report the percentage of students who defaulted on their loans within three years of leaving college. This measure reflects whether students are able to make enough money to repay their loans. Colleges must also report average student loan debt burdens, so students can see what their future payments might look like.

In addition, vocationally oriented programs must report debt and earnings metrics under new federal “gainful employment” regulations. This provides students in technical fields a clear idea of what they might expect to make.

The Obama administration has promised that additional information on student outcomes will be made available “later this summer”, although they have not said what will be made available.

What don’t we know?

Despite the availability of information on some key outcomes, more can still be done to help students make wise decisions about which college to attend.

Below are some example of outcomes that would be helpful for students and their families to know about.

Although enormous gaps in college completion rates exist by family income, students and their families cannot currently access data on the graduation rates of low-income students receiving federal Pell Grants. (The federal government is purchasing data from the National Student Clearinghouse to fix this going forward.)

Colleges are required to report the percentage of minority students and the percentage of students receiving Pell Grants, but nothing is known about the percentage of first-generation students.

This is of particular interest given the key policy goal of improving access to American higher education; without this information, it is harder to tell which colleges are engines of social mobility.

Students need to have more information.
Lynda Kuit, CC BY-ND

Private-sector organizations such as PayScale and LinkedIn work to fill this gap, but they can only provide a limited amount of information.

How could we know more?

The data needed to answer many of the questions above are already held by the federal government, but in multiple databases that are not allowed to communicate with each other.

The greatest barrier to better information from the federal government is due to a provision included in the 2008 reauthorization of the Higher Education Act which banned the federal government from creating a “student unit record” data system that would link financial aid, enrollment and employment outcomes for students receiving federal financial aid dollars. This ban was put in place in part due to concerns over data privacy, and in part due to an intense lobbying effort from private nonprofit colleges.

States, in contrast, are allowed to have unit record data systems, and a few of them make detailed information available to anyone at the click of a mouse.

For example, Virginia makes a host of student loan debt information available in a series of convenient tables and graphics.

Senator Rubio has teamed with Democratic Senators Ron Wyden of Oregon and Mark Warner of Virginia to introduce legislation overturning the ban on unit record data, although no action has yet been taken in Congress.

A bipartisan push to make more information available to students and their families has the potential to help students make better decisions.

But getting data is only one part of the challenge. The other is getting that into the hands of students at the right time. For that, it is important for the federal government to work with college access organizations and guidance counselors.

Students should be able to access this information as they begin considering attending college. Although additional information may not allow a student to graduate debt-free, it will help him or her to make a more informed decision about where to attend college and if the price tag is worth paying.

The Conversation

Read the original article.

Analyzing Trends in Pell Grant Recipients and Expenditures

This post first appeared at the Brookings Institution’s Brown Center Chalkboard blog.

The U.S. Department of Education recently released its annual report on the federal Pell Grant program, which provides detailed information about the program’s finances and who is receiving grants. The most recent report includes data from the 2013-14 academic year, and I summarize the data and trends over the last two decades in this post.

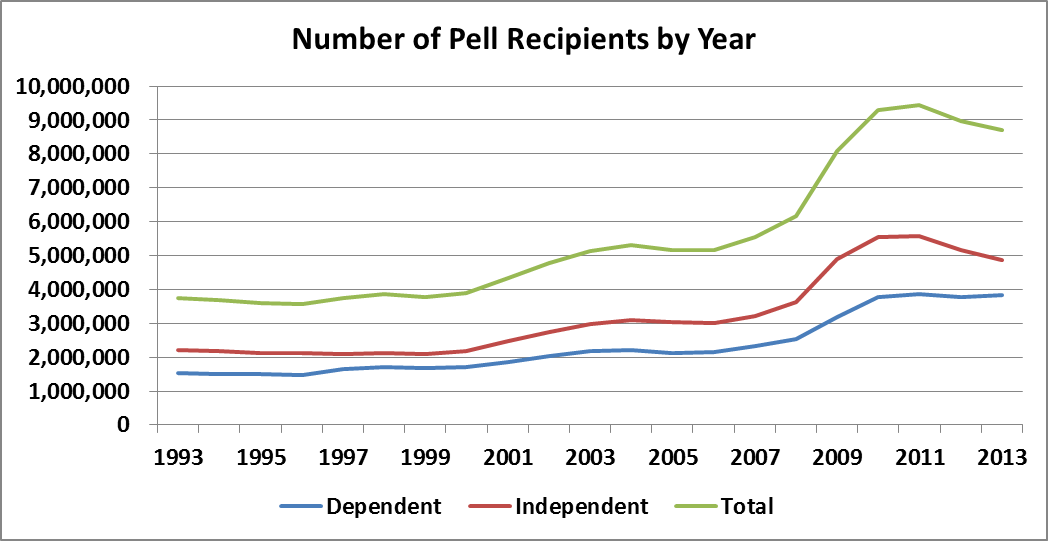
For the second year in a row, the number of Pell recipients fell, going from a peak of 9.44 million students in 2011-12 to 8.66 million in 2013-14. This drop in recipients is almost entirely due to students who are considered independent for financial aid purposes (typically students who are at least 24 years of age, are married, or have a child). The number of independent Pell recipients fell by 13% in the last two years (to 4.87 million), while the number of dependent Pell recipients fell by just 27,000 students to 3.83 million, as shown in the chart below.

pell2015_fig1

Why has the number of Pell recipients declined over the past two years after such a sharp increase between 2008 and 2010? Two factors are at play. First, enrollment at vocationally-oriented colleges (primarily community colleges and for-profit colleges) increases during recessions as displaced workers choose to receive additional training instead of trying to find a job in an awful economy. When the economy gets better, more of these individuals go back to work and forgo college. Second, as the economy has improved, it is likely the case that some families that barely qualified for the Pell Grant during the recession no longer qualified after obtaining a better job.

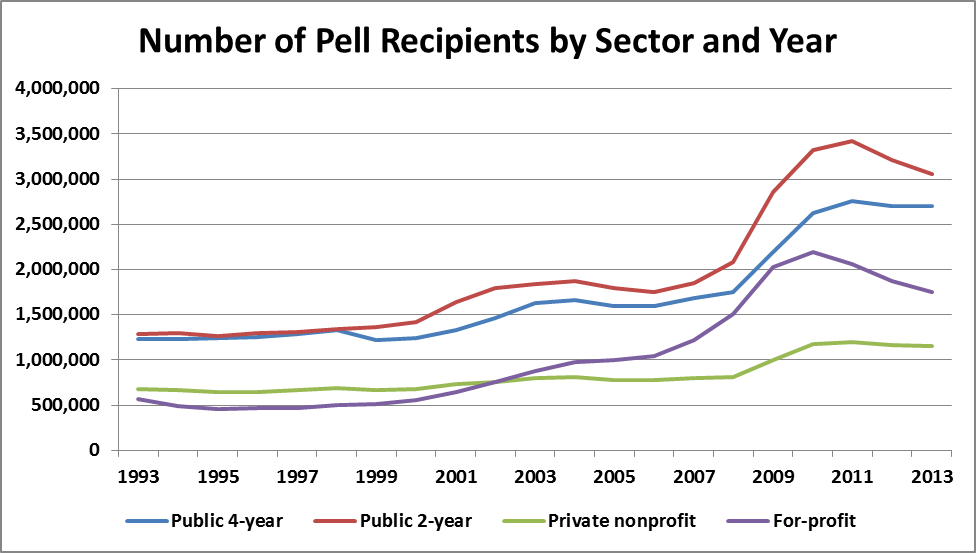
The next chart shows that the decline in the number of Pell recipients over the last two years is largely due to community colleges and for-profit colleges. The number of Pell recipients at community colleges has declined by 11% since 2011-12, while the number at for-profit colleges has declined by 20% since 2010-11 after more than doubling in the previous five years. This is consistent with enrollment at some of the largest for-profit chains cratering in the last few years due to both the colleges’ actions (such as the University of Phoenix enacting a trial period for students) and actions from regulators (as evidenced in the recent collapse of Corinthian Colleges).

pell2015_fig2

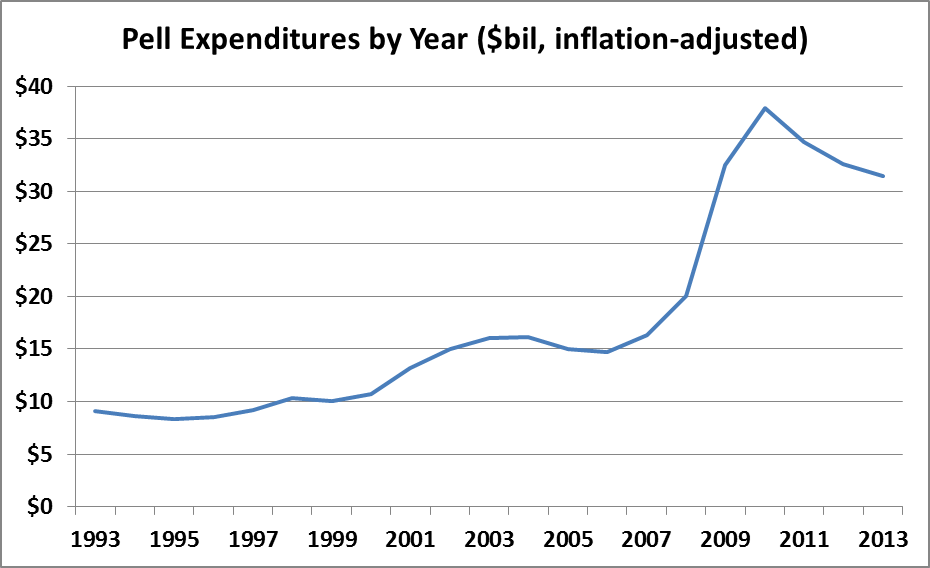
Expenditures for the Pell Grant program declined for a third consecutive year, going from $35.7 billion (in nominal dollars) in 2010-11 to $31.5 billion in 2013-14. However, in inflation-adjusted dollars, Pell spending has still more than doubled since 2007-08.

pell2015_fig3

The big spike in Pell expenditures around 2009 was due to three factors. First, the start of the Great Recession both induced more students to enroll in college and resulted in more students with financial need who met the Pell Grant eligibility criteria. Second, changes to federal laws that took effect in 2009-10 increased the maximum Pell Grant by over $600 and allowed more students to automatically qualify for the maximum Pell Grant by increasing the income threshold (from $20,000 to $30,000) for an automatic zero expected family contribution. Third, students were allowed to receive a Pell Grant on a year-round basis instead of just two semesters during the academic year, driving up short-term costs but potentially helping students complete their studies quicker. In 2011, the year-round Pell provision was repealed and the income threshold for an automatic zero EFC dropped to $23,000 as cost-saving measures. Congress has shown bipartisan interest in allowing year-round Pell again, but changing the income threshold for an automatic zero EFC appears to be off the table for now.

The final chart shows the maximum Pell Grant award (in inflation-adjusted dollars) between 1993-94 and 2013-14. Contrary to what many might expect, the maximum award has increased from $3,696 in 1993-94 to $5,645 today; the average award has also increased from $2,419 to $3,634. But the increase in the Pell Grant’s real value has not kept up with the increasing price of college in all sectors of higher education. As a result, its purchasing power has fallen by two-thirds since 1979.

pell2015_fig4

For those who are interested in learning more about how much in Pell Grant revenue individual colleges receive, I highly recommend the Title IV program volume reports available on Federal Student Aid’s website. In addition to Pell Grant revenue, this site has information on student loan awards going back to the 1999-2000 academic year.

Examining Trends in Living Allowances for College

The National Center for Education Statistics released a new report and data on trends in the cost of attendance for different types of colleges, including data from the 2012-13 to 2014-15 academic years. The report shows that, among colleges operating on a traditional academic year basis (excluding most vocationally-oriented colleges), tuition and fees generally increased at a rate faster than inflation among public and private nonprofit colleges over the last two years. However, tuition failed to keep up with inflation in the for-profit sector and allowances for other living expenses (such as transportation and laundry) declined over the past two years after taking inflation into account.

I dug deeper into the data, looking at the percentage of colleges by sector that increased, decreased, or held constant each of the cost of attendance components (tuition/fees, room and board, books and supplies, and other living expenses) between 2013-14 and 2014-15—without adjusting for inflation. I focused on students living off-campus without their family, as colleges have the ability to determine the room and board allowance but do not directly receive any housing revenue for off-campus students. (My blog post on the topic last year ended up connecting me to Braden Hosch at Stony Brook and Sara Goldrick-Rab at Wisconsin-Madison, and we’ve dug deeper into the accuracy and consistency of these estimates in a working paper.)

The results (below) show that for-profit colleges were far more likely to lower tuition and fees than public or private nonprofit colleges. While 75% of public colleges and 85% of private nonprofits increased tuition, just 42% of for-profit colleges did so. For-profits were also more likely to lower books/supplies and other living expense allowances, although the typical allowance was still higher than for nonprofit colleges. A majority of colleges across sectors increased room and board, while most colleges did not change their allowances for books and supplies.


Table 1: Changes in COA components by sector, 2013-14 to 2014-15.
Private nonprofit
Characteristic (2014-15) Public For-profit
Cost of attendance, students living off-campus without family
  Median ($) 18,328 37,900 28,796
  Increased from 2013-14 (pct) 77.8 84.9 56.3
  No change from 2013-14 (pct) 7.2 5.8 8.2
  Decreased from 2013-14 (pct) 15.0 9.3 35.5
Tuition and fees
  Median ($) 4,200 24,670 14,040
  Increased from 2013-14 (pct) 74.9 84.6 42.3
  No change from 2013-14 (pct) 19.5 11.0 38.5
  Decreased from 2013-14 (pct) 5.7 4.4 19.2
Room and board
  Median ($) 8,280 9,000 7,574
  Increased from 2013-14 (pct) 55.1 56.4 59.2
  No change from 2013-14 (pct) 34.6 34.5 28.2
  Decreased from 2013-14 (pct) 10.4 9.2 12.5
Books and supplies
  Median ($) 1,265 1,200 1,380
  Increased from 2013-14 (pct) 37.8 23.1 25.7
  No change from 2013-14 (pct) 54.4 69.3 59.1
  Decreased from 2013-14 (pct) 7.8 7.6 15.2
Other living expenses
  Median ($) 3,742 3,150 5,000
  Increased from 2013-14 (pct) 42.0 35.1 35.5
  No change from 2013-14 (pct) 36.8 48.9 27.4
  Decreased from 2013-14 (pct) 21.2 16.0 37.1
Number of colleges 1,573 1,233 719
SOURCE: Integrated Postsecondary Education Data System.
Note: Limited to colleges reporting costs on an academic year basis.

Yet as was noted in last year’s blog post on this topic, some colleges set room and board allowances that are unreasonably low by any standard. This year, I focused on the 27 colleges that reduced their room and board allowance for off-campus students by at least $3,000 between 2013-14 and 2014-15. Some of the changes may be reasonable, such as Thomas University’s drop from $15,200 to $10,530 for nine months of room and board. But many others are unlikely to meet any standard of reasonableness. For example, Emory & Henry College in Virginia reduced its allowance from $11,800 for nine months to just $3,000, while the College of DuPage in Illinois cut its allowance from $8,257 to $2,462. Good luck trying to rent an apartment and eating ramen on that budget!

Table 2: Colleges with large declines in off-campus room and board allowances, 2013-14 to 2014-15.
Name State 2013-14 2014-15 Change
Emory & Henry College VA 11,800 3,000 -8,800
Atlanta Metropolitan State College GA 10,753 3,160 -7,593
Mount Carmel College of Nursing OH 13,392 6,380 -7,012
Vanguard University of Southern California CA 11,286 4,600 -6,686
Louisiana Delta Community College LA 15,322 8,789 -6,533
Trinity College of Nursing & Health Sciences IL 12,346 5,858 -6,488
Arkansas Northeastern College AR 11,969 6,102 -5,867
College of DuPage IL 8,257 2,462 -5,795
College of the Mainland TX 11,330 5,665 -5,665
Randolph-Macon College VA 9,200 3,650 -5,550
The University of Texas at Brownsville TX 11,495 6,250 -5,245
SAE Institute of Technology-Nashville TN 15,000 10,000 -5,000
Bon Secours Memorial College of Nursing VA 15,000 10,000 -5,000
Thomas University GA 15,200 10,530 -4,670
Davenport University MI 8,692 4,340 -4,352
Southwestern Illinois College IL 8,516 4,280 -4,236
Lee University TN 11,650 7,520 -4,130
Grace School of Theology TX 12,684 8,584 -4,100
Prairie View A & M University TX 11,289 7,197 -4,092
NY Methodist Hospital Center for Allied Health Education NY 17,568 13,496 -4,072
College of Business and Technology-Flagler FL 12,000 8,320 -3,680
College of Business and Technology-Miami Gardens FL 12,000 8,320 -3,680
Anoka Technical College MN 10,356 6,994 -3,362
Central Penn College PA 6,855 3,500 -3,355
St Margaret School of Nursing PA 9,960 6,640 -3,320
Fortis Institute-Port Saint Lucie FL 12,732 9,495 -3,237
Southern California Seminary CA 14,616 11,493 -3,123
SOURCE: Integrated Postsecondary Education Data System.
Note: Limited to colleges reporting costs on an academic year basis.

Why do some colleges feel pressures to cut back living allowances? It’s all about accountability. The amount of loan dollars students can borrow is limited by the cost of attendance, meaning that reducing living allowances (and hence the cost of attendance) reduces borrowing—and potentially the risk of a college facing sanctions for high student loan default rates. The cost of attendance also determines the net price (the COA after grants are applied), an important accountability metric. Since colleges don’t directly benefit financially from a higher off-campus living allowance, they have an incentive to reduce the living allowance while continuing to increase tuition.

Is Student Loan Debt Really a Crisis?

This article I wrote was originally published on The Conversation.

Americans owed nearly $1.2 trillion in student loan debt as of March 2015, more than three times the amount of debt from just a decade ago. Part of this increase in debt is due to more students attending college, but part can also be attributed to just the borrower holding more debt.

Between the 2007-08 and 2011-12 academic years, nationally representative data from the US Department of Education show the median debt among graduating college seniors who took out loans rising from $20,000 to $26,500. This trend has likely continued over time due to rising tuition prices, meaning that the 70% of students who borrow for a four-year degree can expect to take on over $30,000 in debt in the future. Many students are struggling to repay their loans, as evidenced by high rates of default, delinquency and forbearance due to economic hardships.

These concerns have led some politicians (primarily Democrats) to call mounting student loan debt a “crisis,” while offering potential solutions such as reducing interest rates on student loans, allowing students to refinance their loans at lower rates, or more recently, proposing debt-free public higher education.

But is student loan debt really a crisis?

Debt crisis for whom?

As a professor whose research focuses on higher education finance and accountability policy – and who married an attorney with lots of student loan debt – I look at the student “debt crisis” differently.

I can see the types of students for whom debt is a crisis.

Although there are some exceptions, the crisis is generally not with people like my wife and me, who have advanced degrees and the ability to manage high debt payments due to earning more money (and knowing whether and how to use income-based repayment programs that cap debt payments at a certain percentage of one’s income).

Rather, the crisis is among students with relatively little debt but dismal job prospects.

Research by the New York Federal Reserve Bank found that 35% of students with less than $5,000 in debt defaulted within six years, twice the rate of students with more than $100,000 in debt.

Additionally, these students with low debt amounts and low earnings are disproportionately likely to be dropouts. Sixty-three percent of students who started college in 2003-04 and defaulted on their loans by 2009 were college dropouts, while students with a bachelor’s or associate degree were only 4% of defaults.

Impact of debt

Student loan debt has also been blamed for a range of other negative outcomes in various media articles, including delaying marriage, having children and purchasing a home.

The raw data certainly support the relationship between student loan debt and delaying these key markers of adulthood. It is true that the home ownership rate of young adults without debt exceeded the rate of those with debt for the first time in 2012.

But identifying a causal impact of student loan debt on these outcomes is harder to do: the characteristics of the types of people who went to college and borrowed are different from those who either did not go to college or went to college without taking on debt. For example, students may not borrow for college if their parents foot the bill – and these individuals may also get help putting down a down payment for a house.

Part of the declining home ownership rate among those with debt is likely because college graduates are more likely to move to expensive urban areas than those who did not attend college or take on any debt. Most of the students with little debt are dropouts, not graduates.

In my view, the best empirical research examining whether student loan debt affects home ownership is a working paper by Jason Houle and Lawrence Berger that has found a significant, but small, relationship between student loan debt and home ownership.

However, two different factors could be at play to cause this relationship.

It could be because prospective buyers with debt are unable to obtain a mortgage due to part of their income being needed to pay off student loans. But it could also be because those with debt perceive that they will be rejected if they apply for a loan (even though it may not be true).

Who should be the focus of policy?

Student loan debt is increasingly becoming an unpleasant part of life for millions of Americans, but for many borrowers – particularly those with advanced degrees and high debt burdens – debt is far from a crisis.

For example, the Brookings Institution’s Elizabeth Akers stated in her recent congressional testimony that although the length of student loan payments has increased over time, the average monthly payment has barely increased.

Senator Elizabeth Warren, a darling among progressives, pushed back against Akers, contending that the increasing length of payments construes a debt crisis.

While I’m certainly sympathetic to students frustrated by years of student loan payments, policies designed to help struggling borrowers should focus on students with the greatest need.

Students who left college without a degree and are unable to find a decent job are facing a crisis as they struggle to make ends meet. Our limited resources should be used to help these students complete a credential and repay their loans instead of targeting lawyers with six-figure debt loads.

The Conversation

Robert Kelchen is an assistant professor of higher education at Seton Hall University.

Read the original article.

New Evidence on the Bennett Hypothesis and Federal Student Aid

One of the eternal debates in higher education policy is the validity of the Bennett Hypothesis, first stated by William Bennett (President Reagan’s Secretary of Education) in 1987:

“If anything, increases in financial aid in recent years have enabled colleges and universities blithely to raise their tuitions, confident that Federal loan subsidies would help cushion the increase. In 1978, subsidies became available to a greatly expanded number of students. In 1980, college tuitions began rising year after year at a rate that exceeded inflation. Federal student aid policies do not cause college price inflation, but there is little doubt that they help make it possible.”

Does the availability of federal financial aid give colleges an incentive to keep hiking tuition? I wrote about the existing research on the Bennett Hypothesis last fall, which has been one of the most-read posts in my three years of blogging. At that time, I concluded that although it’s quite possible that federal financial aid is associated with increased tuition, it was hard to draw a solid conclusion given data limitations and the fact that nearly all students can receive federal financial aid—limiting the ability to draw causal inferences.

But two recent studies have pushed the research frontier forward by estimating the relationship between small changes in federal aid and colleges’ pricing strategy. The first is a job market paper by Christopher Lau, a recent economics PhD graduate from Northwestern. Using a rather complicated analytic strategy (read the methods section and see for yourself!), he estimated that for-profit colleges captured approximately 57 cents of each additional dollar of federal grant aid and 51 cents of each additional dollar of federal loan aid. Community colleges captured a smaller portion of federal aid dollars (37% of grant aid and 25% of loan aid), which is unsurprising given that the maximum Pell Grant is larger than community college tuition in nearly all states. Additionally, states often limit the amount that public colleges can increase tuition, reducing the opportunity for strategic behavior.

The second examination of the Bennett Hypothesis is a newly released report from three economists at the New York Fed. They used increases to federal subsidized and unsubsidized loan limits in 2007 as well as maximum Pell Grant awards to see whether colleges responded by increasing tuition. They found that colleges did increase posted tuition (not necessarily net tuition) at a higher rate after loan limits increased, with the magnitude being approximately 55 cents for each dollar of additional Pell Grant aid and 65 cents for each dollar of subsidized loan aid. These effects were largest for the most expensive private nonprofit colleges, where the maximum amount of federal loans ($5,500 for a first-year student) only covers a small portion of tuition.

An even more interesting finding from the Fed paper is that shareholders in for-profit colleges responded favorably to the passage of legislation that increased federal financial aid amounts. They concluded that across three pieces of legislation, the cumulative increase in stock prices was about 10% above what would have been expected without an increase. Given the high (at the time) public valuations of large publicly traded for-profits, this represented a large increase in valuation. It is also worth noting that because for-profits have to get at least 10% of their revenue from non-federal sources or veteran’s benefits, some colleges may have had to increase tuition in order for students to take out private loans to stay clear of the so-called ‘90/10’ rule.

Both of these papers have some major limitations. Most notably, they are unable to account for whether students took out less in PLUS or private loans when subsidized loans and Pell Grants increased and do not look at net tuition after grant aid. However, these represent some of the best evidence of there being some truth to the Bennett Hypothesis for the most expensive colleges. But does this lend credence to the claim that tuition will become much less expensive if the federal government got out of the student aid business? As a researcher, I urge caution with that interpretation for two reasons. First, these studies only tell us what happens when more aid goes into the system. The relationship may not hold when less aid comes in. Second, these findings are based on relatively small changes in aid—often less than $1,000. These ‘local’ effects may not hold for a larger change.

The Rise and Fall of Federal College Ratings

President Obama’s 2013 announcement that a set of federal college ratings would be created and then tied to federal financial aid dollars caught the higher education world by surprise. Some media coverage at the time even expected what came to be known as the Postsecondary Institution Ratings System (PIRS) to challenge U.S. News & World Report’s dominance in the higher education rankings marketplace. But most researchers and people intimately involved in policy discussions saw a substantial set of hurdles (both methodologically and politically) that college ratings would have to clear before being tied to financial aid. This resulted in a number of delays in the development of PIRS, as evidenced by last fall’s delayed release of a general framework for developing ratings.

The U.S. Department of Education’s March announcement that two college ratings systems would be created, one oriented toward consumers and one for accountability purposes, further complicated the efforts to develop a ratings system. As someone who has written extensively on college ratings, I weighed in with my expectation that any ratings were becoming extremely unlikely (due to both political pressures and other pressing needs for ED to address):

This week’s announcement that the Department of Education is dropping the ratings portion of PIRS (is it PIS now?) comes as little surprise to higher education policy insiders—particularly in the face of bipartisan legislation in Congress that sought to block the development of ratings and fierce opposition from much of the higher education community. I have to chuckle at Education Undersecretary Ted Mitchell’s comments on the changes; he told The Chronicle of Higher Education that dropping ratings “is the exact opposite of a collapse” and “a sprint forward.” But politically, this is a good time for ED to focus on consumer information after its recent court victory against the for-profit sector that allows the gainful employment accountability system to go into effect next week.

It does appear that the PIRS effort will not be in vain, as ED has promised that additional data on colleges’ performance will be made available on consumer-friendly websites. Although I am skeptical that federal websites like the College Scorecard and College Navigator directly reach students and their families, I am a believer in the power of information to help students make at least decent decisions, but I think this information will be more effective when packaged by private organizations such as guidance counselors and college access organizations.

On a historical note, the 2013-2015 effort to rate colleges failed to live up to efforts a century ago, in which ratings were actually created but President Taft blocked their release. As Libby Nelson at Vox noted last summer, President Wilson created a ratings committee in 1914, which then came to the conclusion that publishing ratings was not desirable at the time. 101 years later, some things still haven’t changed. College ratings are likely dead for decades at the federal level, but performance-based funding or “risk-sharing” ideas enjoy some bipartisan support and are the next big accountability policy discussion.

I’d love to be able to write more at this time about the path forward for federal higher education accountability policy, but I’ve got to get back to putting together the annual Washington Monthly college rankings (look for them in late August). Hopefully, future versions of the rankings will be able to include some of the new information that has been promised in this new consumer information system.

It’s Time to Make Accreditation Reports Public

The higher education world is abuzz about this week’s great piece in The Wall Street Journal questioning the effectiveness of higher education accrediting agencies, whose seal of approval is required for a college to receive federal student financial aid dollars. In the front-page article, Andrea Fuller and Douglas Belkin of the WSJ note that at least 11 accredited four-year colleges had federal graduation rates (excluding part-time and transfer students, among others) below 10%, which leads one to question whether accreditors are doing their job in ensuring institutional quality. A 2014 Government Accountability Office report concluded that accreditors are more likely to yank a college’s accreditation over financial concerns than academic concerns, calling for additional oversight from the U.S. Department of Education.

Congress has also been placing pressure on accreditors in recent weeks due to the collapse of the accredited Corinthian chain of for-profit colleges and the Department of Education’s announcement that at least some Corinthian students will qualify for loan forgiveness. The head of the main accreditation body responsible for most Corinthian campuses got grilled by Senate Democrats in a hearing this week for not pulling the campuses’ accreditation before the chain collapsed. As a part of the (hopefully) impending reauthorization of the Higher Education Act, members of Congress on both sides of the aisle are interested in a potential overhaul of the accreditation system.

Students, their families, policymakers, and the general public have a clear and compelling interest in reading the reports from accrediting agencies and knowing whether colleges are facing sanctions for some aspect of academic or fiscal performance. Yet these reports, which are produced by nonprofit accrediting agencies, are rarely available to the public. For the WSJ piece, the reporters were able to use open-records requests to get accreditation reports for 50 colleges with the lowest graduation rates. I was recently at a conference where the GAO presented on their aforementioned accreditation report and asked whether the data they compiled on accreditor sanctions was available to the public. They suggested I file an open records request, something which I’ve (unsuccessfully) done for another paper.

Basic information about a college’s accreditation status and reports –including any sanctions and key recommendations for improvement—should be readily available to the public as a requirement for federal financial aid eligibility. And this should cover all types of colleges, including private nonprofit and for-profit colleges that accept federal funds. The federal government doesn’t necessarily have to get involved in an accreditation process (a key concern of colleges and universities), but it can use its clout to make additional data available to the public. (Students probably won’t go to the college’s website and read the reports, but third-party groups like guidance counselors and college rankings providers would work to get the information out in more usable form.) A little sunshine in the accreditation process has the potential to be a wonderful disinfectant.

What if College Amenities Were Unbundled?

Recent articles by Jeff Selingo in the Washington Post and Matt Reed in Inside Higher Ed have address the idea of “unbundling” college credits. Selingo contends in his piece that two of the reasons why students pay so much for college is that they face the same price if taking 12 or 15 credits per semester (true at many colleges) and that colleges don’t always accept transfer credits in an effort to generate revenue (probably true, but difficult to prove). Reed notes an important distinction regarding transfer credits—although students may get credit for a community college course at a four-year institution, the credit might be granted as an elective that still requires the student to take the course over again.

Both Selingo and Reed refer to the push to allow consumers to unbundle their cable packages as a potential example of what to do (or not to do) in higher education. Currently, consumers have to choose a bundle of channels in order to get the particular channel or two they are the most interested in actually watching. A recent report estimated that cable companies paid an average of $6.04 per month to carry ESPN—and this gets passed along to consumers regardless of whether they actually want to watch the channel. Verizon has recently allowed subscribers to choose what types of channels they want to pay for, and Disney (the owner of ESPN) promptly sued to maintain the bundle. Disney’s fear is that maybe only half of the subscribers would pay $6 per month for ESPN, meaning that the price would have to double in order to match the previous revenue—at which point more customers would likely opt out.

Higher education offers similar examples of bundling that would quite possibly be brought down if students had the choice to select their preferred options. At many colleges, amenities such as recreation centers and intercollegiate athletics programs are funded through mandatory student fees. For example, the typical Big Ten Conference university charges students about $150 per semester in fees to fund recreational activities, regardless of whether a student actually chooses to use any facilities. While students often vote to approve the initial imposition of the fee, students who enroll in later years still have to pay the fee even if they would not have voted for it in the first place.

Fees for supporting intercollegiate athletics can be over $1,000 per year at some colleges, particularly at institutions without large donor bases or other revenue sources. An example is Longwood University in Virginia, which charges $239 per credit hour in tuition alongside over $63 per credit in athletics fees. This means that Longwood students taking 120 credits would be paying about $7,500 to subsidize athletics during their time on campus, something which many students might opt out of it they had a chance.

Higher education could be unbundled in other ways, including removing any requirements that students live on campus or purchase a meal plan, ending provisions requiring students to complete a certain number of credits in residency, or even potentially through the encouragement of open courseware that does not require an expensive subscription through the college. But any such efforts to unbundle will take away important revenue sources, so expect colleges to compensate in any way that they can. There is value in some of the bundling requirements, to be sure—for example, campus mental health services may not be offered if students had to opt into paying for the ability to access services. But it is worth having a conversation about what should be bundled and what should be provided on an a la carte basis.

Is “Overborrowing” for College an Epidemic?

As the Senate Health, Education, Labor, and Pensions Committee continues to slowly move toward Higher Education Act reauthorization, the committee held a hearing this week on the possibility of institutional risk-sharing with respect to federal student financial aid programs. This idea, which has bipartisan support at least in principle, would require at least some low-performing colleges to be responsible for a portion of loans not repaid to the federal government. (I’ve written about this idea in the past.)

Sen. Lamar Alexander (R-TN), the committee chair, began his opening statement with a discussion of “overborrowing,” which he defines as students borrowing more than they need to in order to attend college. Along with Sen. Michael Bennet (D-CO) and other colleagues, he is sponsoring the FAST Act, which contains a provision that would prorate the amount of funds part-time students can borrow for living expenses. Financial aid administrators are also concerned about overborrowing, as evidenced by their professional association’s push to allow colleges to offer students less than the maximum loan amount. This is also something that Sen. Alexander discussed in his opening statement.

But there is no commonly-accepted definition of “overborrowing,” nor is there empirical research that clearly defines how much borrowing is too much. I can see why policymakers want to limit the amount of money that part-time students can borrow for living expenses while in college, as students may hit their lifetime loan caps before completing their degrees as part-time students. But, as research that I’ve conducted with Sara Goldrick-Rab at Wisconsin and Braden Hosch at Stony Brook shows, about one-third of all colleges set living expenses at least $3,000 below what it likely costs to live. This effectively limits student borrowing, as they cannot have a financial aid package exceeding the cost of attendance.

Some people have said that high student loan default rates are a clear indicator that overborrowing is a common concern. Yet students with a small amount of debt are at a higher risk of default, as many of them dropped out of college without a degree and were unable to find gainful employment. It could be the case that borrowing more money would be a better decision, as that money might help students stay in college and complete degrees. However, a substantial percentage of students from low-income families are loan-averse—either completely unwilling to take on debt or only willing to take on a bare minimum as a last resort. Underborrowing is the concern in higher education funding that few people are talking about, and it deserves additional study.

Finally, it is worth a reminder that the typical student graduating with a bachelor’s degree has about $30,000 in debt, although there are huge differences by race/ethnicity and family income. This is in spite of media reports that focus on borrowers with atypically high debt burdens. While I’m concerned about the substantial percentage of students borrowing large amounts of money for graduate school (and particularly the implications for taxpayers due to the presence of income-based repayment programs), it’s hard to convincingly argue that overborrowing for an undergraduate degree is truly an epidemic.

How Should State Higher Education Funding Effort Be Measured?

The question of whether states adequately fund public higher education has been a common discussion over the last few decades—and the typical answer from the higher education community is a resounding “No.” This is evident in two recent pieces that have gotten a lot of attention in recent weeks.

The first piece is a chart put out by the venerable Tom Mortensen at the Pell Institute that shows that higher education funding effort (as measured by appropriations per $1,000 in state personal income) has fallen to 1966 levels, which was then picked up by the Washington Post with the breathless headline, “How quickly will states get to zero in funding for higher education?” (The answer—based on trendlines—no later than 2050.) The second piece is from Demos and claims that state funding cuts are responsible for between 78% and 79%1 of the increase in tuition at public universities between 2001 and 2011.

Meanwhile, state higher education appropriations are actually up over the last five fiscal years, according to the annual Grapevine survey of states. In Fiscal Year 2010 (during the recession), state funding was approximately $73.9 billion, falling slightly to $72.5 billion by FY 2013. But the last two fiscal years have been better to states, and higher education appropriations have risen to nearly $81 billion. Higher education has traditionally served as a balancing wheel for state budgets, facing big cuts in tough times and getting at least some increases in good times. However, this survey is not adjusted for inflation, making funding increases look slightly larger than they actually are.

So far, I’ve alluded to four different ways to measure state higher education funding effort:

(1) Total funding, not adjusted for inflation (the measure state legislatures often prefer to discuss).

(2) Total funding, adjusted for inflation.

(3) Per-full time equivalent student funding, adjusted for inflation (the most common measure used in the research community).

(4) Funding “effort” per $1,000 in state income (a measure popular with education advocates).

So which measure is the right measure? State legislatures tend not to care about inflation-adjusted or per-student metrics because their revenue streams (primarily taxes) don’t necessarily increase alongside inflation or population growth. Additionally, enrollment for the next year or two can be difficult to accurately predict when budgets are being made, so a perfect per-FTE funding ratio is virtually impossible. But on the other hand, colleges have to make state funding work to educate an often-growing number of students, so the call for the maintenance of funding ratios makes perfect sense.

I raise these points because policymakers and education advocates often seem to talk past each other in terms of what funding effort for higher education should look like. It’s important that both sides understand where the other is coming from in terms of their definition in order to work to find common ground. And I’d love to hear your preferred method of defining ‘appropriate’ funding effort, as well as why you chose that method.

———-

1 I question the exact percentage here, as it’s the result of a correlational study. To claim causality (as they do in Table 6), the author needs to establish causality—some way to separate the effects of dropping per-student state support from other confounding factors (such as changing preferences toward research). This can be done by using panel regression techniques to essentially compare states with big funding drops to those without, after controlling for other factors that would be affecting higher education across states. But it’s hard to imagine a situation in which per-student state funding cuts aren’t responsible for at least some of the tuition increases over the last decade.