Yesterday, I revealed the first half of my list of top ten higher education events of 2015. Today, I reveal the top five events from the past year, with a list of ‘not top ten’ events (events that either didn’t go as planned or don’t benefit students or the general public) to come tomorrow.
- Federal college ratings are dead, but the College Scorecard data represent a big step forward.
The U.S. Department of Education (ED) closed out 2014 by releasing a set of potential metrics for their much-anticipated (and much-reviled in many parts of higher education) Postsecondary Institution Ratings System. The framework at that point was so rough that I told Politico that “I’d be surprised” if any ratings were released by the Obama Administration’s goal of fall 2015. The ratings plan was pretty much dead by March, when an ED official announced that two rating systems would be created—one focused on consumer information and one focused on accountability. Given the difficulty of doing two big projects at once, it was no shock to see accountability-focused ratings dropped in June (see my full postmortem here).
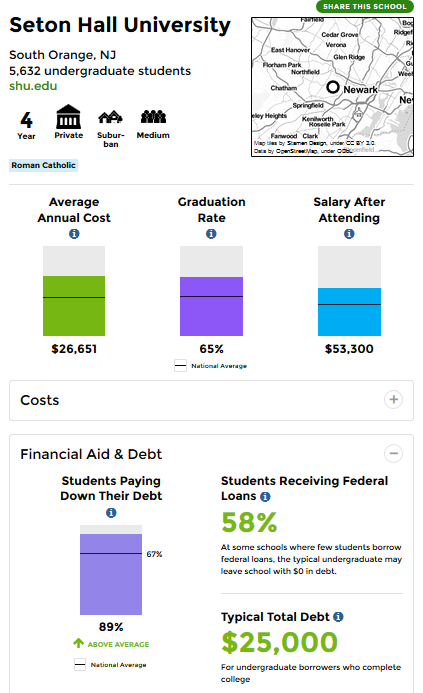
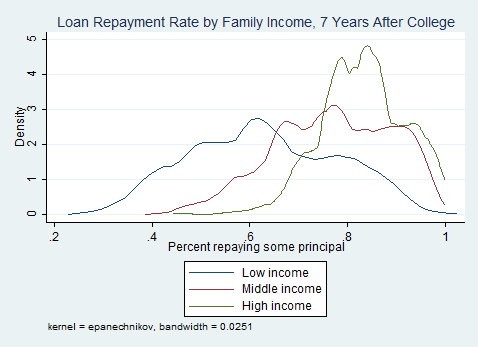
Although ED had promised that additional information would be released in the College Scorecard tool, I didn’t expect the sheer magnitude of what was released on an otherwise-tranquil Saturday morning in September. The new public-facing College Scorecard site has information about typical student loan debt, the percentage of students paying down principal on their loans, and the median earnings of former students 10 years after starting college—important data points for students and the public to consider. Even more importantly, ED made up to 18 years of more detailed outcomes data downloadable online (caution: large file sizes!) for everyone to use as they see fit. These data will be used to inform policy discussions going forward, as well as to help students make better college choices (or at least avoid awful choices).
- The federal government erases student loan debts of some students who attended the now-closed Corinthian Colleges.
The rapid collapse of the for-profit Corinthian Colleges chain was the top higher education event on my 2014 list, but its repercussions will continue to be felt for years to come. In June, the Obama Administration announced that at least 40,000 students at Corinthian-owned Heald College could have their loans erased due to the college’s fraudulent practices. That could cost over $500 million (so far, $28 million has been forgiven), but total costs for debt forgiveness across all Corinthian campuses could reach $3.2 billion.
The big policy question going forward is whether more students who attended for-profit—or even nonprofit—colleges with dubious recruiting practices or phony job placement data will be able to have their loans forgiven by the federal government. Some Democratic senators, including liberal icon Elizabeth Warren of Massachusetts, have called for forgiveness to be extended to other large for-profit chains with practices that were allegedly similar to Heald. This would benefit tens of thousands of students, but come at a cost of billions of dollars to taxpayers as these colleges typically don’t have enough money to reimburse the federal government. This issue will continue to be important for years to come.
- Led by Tennessee, ‘tuition-free’ and ‘debt-free’ higher education becomes a hot political discussion.
The Tennessee Promise program, which offers tuition-free community college as well as some mentoring services to qualified recent high school graduates, has been widely hailed as a bipartisan policy success. Enrollment in Tennessee public higher education increased by 10.1% in fall 2015, with large increases at community colleges far outpacing declines at some four-year public and private colleges. This increase in enrollment is taking place even though many students receiving federal Pell Grants do not get a dime from the Tennessee Promise program, as Tennessee’s ‘last-dollar’ design means that the state picks up the tab after all other grant aid has been applied. Clearly, program messaging matters—and a clear message of affordability goes a long way.
In addition to a number of states considering tuition-free community college, the Obama Administration proposed its own version at the national level in January. This plan is quite different from the Tennessee Promise, with notable differences being that Obama’s plan is ‘first-dollar’ (supplementing instead of supplanting the Pell Grant) and includes several additional requirements on states and students. All three major Democratic candidates (Clinton, O’Malley, and Sanders) have released plans for at least some tuition-free or debt-free public higher education this year. While it’s unlikely that any of these happen at a national level due to Republican opposition and cost concerns, states may move forward with their own plans.
- The Department of Education adopts ‘prior prior year’ (PPY), allowing students to file for federal financial aid earlier starting next October.
Currently, students cannot file the Free Application for Federal Student Aid (FAFSA) until January 1 for attending college the following fall. This means that students often do not get any information about their Pell Grant or student loan eligibility until February or March as they wait for their final tax documentation from the prior year. This is too late to influence the college choice processes of many students attending four-year colleges, as application deadlines at somewhat selective institutions are often well before this date. Moving up the FAFSA timeline by up to one year (by using tax data from the year prior to what is currently being used) would help students get earlier information about college prices.
I’ve done a fair amount of research the past few years (thanks to generous support from the National Association of Student Financial Aid Administrators and the Gates Foundation) on the financial implications of PPY. I co-authored a report that found that PPY wouldn’t affect the Pell Grant awards of the vast majority of students, alleviating one of the key concerns against switching to PPY (the journal article version with cost estimates is available here). I’m quite happy that President Obama ordered a switch to PPY starting in fall 2016, meaning that students can file the FAFSA on October 1 instead of the following January 1. The transition in 2016 could be difficult from a technical perspective, but it’s a win for students going forward.
- Student protests shake up higher education in a way not seen in decades.
Any good analysis of the history of American higher education has a substantial section of the protest and free speech movements on college campuses in the 1960s. Yet, for those of us who went to college in the last 40 years, protests have been relatively few and far between (with most of these protests being focused on foreign policy endeavors). Having been in graduate school at the University of Wisconsin-Madison during the massive protests against Governor Scott Walker’s changes to collective bargaining rules, I didn’t expect to see anything of that magnitude again for years to come.
But this fall’s protests at Yale, the University of Missouri, and many other colleges around the country over concerns of racism and a lack of diversity on and near college campuses have the potential to represent a new wave of student activism. The most successful protests to this point have been at the University of Missouri, where the chancellor of the flagship Columbia campus and the president of the four-campus system both resigned under pressure from a student on a hunger strike, Mizzou’s football team, and a number of deans who wanted change. The rationales for these protests aren’t likely to go away in 2016, and there are a number of unanswered questions. Will higher education change as a result of protests? Will leaders at other campuses be forced to resign? What are the unintended consequences of the protest movement? Are there potential concerns about free speech on campuses?
Also considered: Colleges competing for athletes based in part on the cost of attendance, more colleges adopting test-optional policies for admission, ED’s release of colleges facing heightened cash monitoring, risk sharing for federal student loans, continued growth of state performance-based funding policies, new admissions coalition breaks away from the Common Application.