Examining Trends in Debt to Earnings Ratios

I was just starting to wonder when the U.S. Department of Education would release a new year of College Scorecard data, so I wandered over to the website to check for anything new. I was pleasantly surprised to see a date stamp of April 25 (today!), which meant that it was time for me to give my computer a workout.

There are a lot of great new data elements in the updated Scorecard. Some features include a fourth year of post-graduation earnings, information on the share of students who stayed in state after college, earnings by Pell receipt and gender, and an indicator for whether no, some, or all programs in a field of study can be completed via distance education. There are plenty of things to keep me busy for a while, to say the least. (More on some of the ways I will use the data coming soon!)

In this update, I share data on trends in debt to earnings ratios by field of study. I used median student debt accumulated by the first Scorecard cohorts (2014-15 and 2015-16 leavers) and tracked median earnings one, two, three, and four years after graduating college. The downloadable dataset includes 34,466 programs with data for each element.

The below table shows debt-to-earnings ratios for the four most common credential levels. The good news is that the average ratio ticked downward for each credential level, with bachelor’s and master’s degrees showing steep declines in their ratios than undergraduate certificates and associate degrees.

Credential1 year2 years3 years4 years
Certificate0.4550.4300.4210.356
Associate0.5280.5030.4730.407
Bachelor’s0.7030.6590.5690.485
Master’s0.8330.7930.7340.650

The scatterplot shows debt versus earnings four years later across all credential levels. There is a positive correlation (correlation coefficient of 0.454), but still quite a bit of noise present.

Enjoy the new data!

Trends in Debt and Earnings for Common Programs of Study

The Department of Education’s updated College Scorecard dataset contains two new features at the program level. (I looked at the new institution-level data in my previous post.) The first feature is information on median Parent PLUS loan debt and the number of students whose parents take on debt. The second is earnings two years after graduation, which added onto last year’s one-year data.

In this post, I constructed a dataset of students who graduated in the 2014-15 and 2015-16 academic years combined with one-year earnings from calendar years 2016 and 2017 and two-year earnings from calendar years 2017 and 2018. (A note to analysts: the most recent data file shows debt for the 2016-17 and 2017-18 graduating cohorts, one-year earnings from the 2015-16 and 2016-17 cohorts, and two-year earnings from the 2014-15 and 2015-16 cohorts. This will result in some funky numbers, so download the big dataset instead and do your own merging.) I then pulled data for fields of study that had data from 50 or more programs at each credential level.

You can download my summary dataset here, and some key findings are below.

Undergraduate certificate

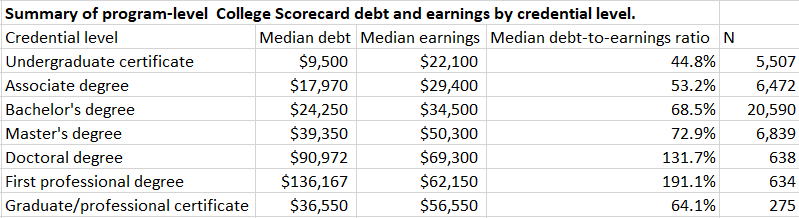
Both earnings and debt burdens are typically fairly low, and two-year earnings were always higher than one-year earnings (which was true across all programs and credential levels). The median cosmetology graduate had (reported) earnings of just $17,821 two years after graduation, but median student debt was $12,851, only about 14% of student borrowers had their parents take on Parent PLUS loans, and median PLUS debt was just $7,397. Vehicle maintenance and repair had the second-highest two-year earnings ($33,632, just behind nursing at $34,108), but about 34% of borrowers had Parent PLUS loans of nearly $15,000.

Associate degree

Parent PLUS loans were relatively uncommon at this level, with the exception of culinary arts (about 20% of students had parents with PLUS debt). Registered nurses earned $57,247 per year, far higher than any other field. Liberal arts/general studies graduates had modest earnings ($26,159), but their student debt burdens of $13,452 were at least $10,000 below all other fields of study.

Bachelor’s degree

Earnings two years after graduation ranged from $25,243 in fine arts to $66,218 in mechanical engineering. A large number of majors clustered between $30,000 and $35,000 in earnings, while student debt was typically between $25,000 and $31,000.  Fields dominated by adults, such as health/medical administration, had much higher student debt burdens due to their ability to access higher independent loan limits. PLUS loan amounts typically ranged between $20,000 and $30,000, but human resources ($13,637), liberal arts (16,450), design ($40,231) and film ($46,006) stood out as outliers. Film was also a concern in that about 41% of student borrowers also had Parent PLUS loans. This compares to fields like business and nursing, where 10%-15% of students had their parents take on loans.

Master’s degree

The variation in debt (from that institution only) and earnings was much larger for master’s degrees. Two-year earnings ranged from $27,941 in music to $102,895 in earnings, and debt ranged from $27,492 in curriculum and instruction to $95,823 in allied health. Only six programs had debt burdens larger than second-year earnings, led by mental health services at 1.43. Surprisingly, theology graduates (at $44,485) earned nearly as much as criminal justice graduates (at $46,269).

Doctoral degrees

Based on these data alone, going to medical school looks like a terrible life choice as two-year earnings were $58,056 compared to debt of $167,169. However, most new medical doctors do a residency of three years or so before launching into a well-paid career. Pharmacy and nursing graduates see six-figure salaries from the start and have less debt. And I have to give a shout-out to educational administration programs. The overall numbers are solid (earnings of $79,713 compared to debt of $68,877). Graduates of the department that I chair at Seton Hall earned $111,435 with debt of $62,841. Time to hit people up for donations???

A First Look at Parent PLUS Loan Burdens of Graduates

Earlier this week, the U.S. Department of Education released its long-awaited updates to the College Scorecard website and dataset. The updated institution-level dataset has two glaring omissions that carried over from last year’s update. The first is that student loan repayment rates are no longer tracked, which is frustrating given the size of the federal government’s student loan portfolio. Taxpayers and students have the right to know whether students can manage their loans without heavy reliance on income-driven repayment. The second is that post-college earnings are excluded once again at the institution level. The program-level dataset (which I will discuss in a future post) has data, but just for graduates. That’s really useful for colleges with low graduation rates!

But in good news, this year’s Scorecard includes data on Parent PLUS loans. There are currently $101 billion in Parent PLUS Loans outstanding, $10 billion more than just two years ago. Parent PLUS loans do not count in the current cohort default rate measure, but the few studies that have gained access to PLUS data suggest that default and repayment are concerns. Because the older parents of students are expected to pay off these loans as they approach retirement, Parent PLUS loans also raise concerns about the intergenerational transmission of wealth and the growing racial wealth gap in America.

In this blog post, I dig into new Scorecard data on median Parent PLUS loan debt among 2017-18 and 2018-19 graduates, focusing on bachelor’s degree recipients attending 1,103 public and private nonprofit colleges (excluding special-focus institutions) that had sufficient data on student debt and other institutional characteristics.

First of all, the median institution had median Parent PLUS debt among borrowers of $24,399 and median student debt among borrowers of $24,250. The first graph below show that median student debt and median parent debt are only weakly correlated. This is not surprising due to the presence of loan limits for undergraduate students (a maximum of $31,000 for dependent students). But it does seem like some students turn to parent loans after hitting the cap on student loans.

The Scorecard also provides an estimate of the percentage of students whose parents took PLUS loans, and the upper bound of the estimate is 15%. The next graph shows the relationship between the percentage of students whose parents take on loans and median parent debt. There is a positive relationship here, although this is driven in part by the small number of colleges with high borrowing rates. Very few colleges have more than 30% of parents taking on PLUS loans.

The next graph examines the relationship between Parent PLUS debt and the percentage of students who received Pell Grants in 2013-14 (the likely entry year for many of these graduates). There is a strong negative relationship, which could be due to expensive private colleges being more likely to have fewer Pell recipients. The parents of Pell recipients may also seek to borrow less money than non-Pell parents, which is strongly hinted at in Scorecard data that separates borrowing by Pell status.

Historically black colleges get a lot of attention for high Parent PLUS loan burdens, but this did not hold in my sample. The 50 HBCUs with complete data had median PLUS debt of $16,531 and median student debt of $29,502. This compared to $24,540 in PLUS debt and $24,000 in student debt for non-HBCUs. HBCU graduates likely have more in student debt because students can borrow more under their own name if their parents do not qualify for PLUS loans. The two graphs below show no consistent relationship between parent debt and the share of Black or White students.

Finally, I peeked at institutional selectivity (proxied here by ACT composite scores). As median ACT scores rose, parent debt also rose. This is likely due to selective colleges being much more expensive and parents being willing to spend lots of money to send their children there.

My next post will dive into the new program-level data, but I’m happy to take requests for additional institution-level factors to consider that could affect parent debt. This could turn into an interesting short journal article!

A Look at High and Low Earning Programs of Study

Not surprisingly, last week’s release of program-level earnings data in the newest version of the College Scorecard got a lot of attention both inside and outside the higher education community. I have gotten quite a few requests from reporters to dive deeper into the data, and I am happy to oblige with a look at which programs have graduates with the highest and lowest median salaries approximately one year after graduation.

First, a few methodological notes. I decided to look at three groups of credentials: certificates and associate degrees from two-year colleges, bachelor’s degrees from four-year colleges, and graduate credentials (certificates, master’s degrees and doctoral/first professional degrees) from research universities. I defined my samples by merging 2018 Carnegie classifications into the Scorecard data and only analyzing colleges with more than five programs that had enough observations in the dataset to have median earnings reported. So think of this as a look at some of the larger programs of study, with the caveat that the Scorecard’s definition of “program” often encompasses multiple academic majors as they are typically defined.

Now that the methods are set forth, let’s dive into the data. 175 two-year colleges met the above requirements for being in the sample, with 176 programs being represented for minimum and maximum earnings due to ties. Nursing programs were more than one-third of the highest earning programs, while criminal justice was the most common low-earning program.

Most common programs for lowest and highest earnings, two-year colleges.

Lowest earnings (n=176) Highest earnings (n=176)
Criminal justice (n=31) Nursing (n=65)
Health/medical administration (n=27) Information technology (n=18)
Teacher education (n=23) Fire protection (n=14)
Liberal arts (n=16) Allied health diagnostics (n=12)
Cosmetology (n=11) HR management (n=8)
Human development (n=8) Medical assisting (n=7)
Allied health (n=8) Dental support services (n=6)
Median earnings: $21,000 Median earnings: $51,800

At the bachelor’s degree level, 958 colleges were represented with more than five programs. Liberal arts programs in fields such as psychology, drama, and English had the lowest earnings, but biology was the third most common program to have the lowest earnings at the institution. On the high end, nursing was by far the most common program, followed by a number of STEM and business-related degrees.

Most common programs for lowest and highest earnings, bachelor’s degrees.

Lowest earnings (n=972) Highest earnings (n=964)
Psychology (n=92) Nursing (n=352)
Drama/theatre arts (n=84) Computer science (n=93)
Biology (n=77) Information technology (n=75)
English language/literature (n=77) Electronics engineering (n=57)
Fine and studio arts (n=68) Accounting (n=49)
Health and fitness (n=42) Business administration (n=34)
Music (n=37) Computer engineering (n=31)
Median earnings: $22,400 Median earnings: $63,150

 I then looked at the 323 Carnegie doctoral/research universities that had more than five graduate programs with data. The patterns for programs with the lowest earnings are similar, with music, health and fitness, and fine arts popping up on the bachelor’s degree and graduate credential lists. And again, nursing is the most common program with the highest earnings. (Is there a trend?)

Most common programs for lowest and highest earnings, graduate programs.

Lowest earnings (n=330) Highest earnings (n=323)
Music (n=45) Nursing (n=100)
Student counseling (n=32) Business administration (n=42)
Social work (n=24) Pharmacy (n=39)
Health and fitness (n=15) Allied health diagnostics (n=27)
Teacher education (n=14) Educational administration (n=21)
Fine and studio arts (n=13) Dentistry (n=10)
Mental/social health services (n=13) Advanced dentistry (n=8)
Median earnings: $35,700 Median earnings: $103,900

Naturally, when I dug into the data, I wanted to see how my program looked in the College Scorecard data. The doctoral program in educational administration at Seton Hall has median graduate earnings of $110,200 one year after completion, which makes it the university’s highest-paid program (nursing is second at $96,000). Educational administration programs do pretty well, thanks in large part to serving adult students working as principals, superintendents, or higher education administrations. But this is a broad category, including EdD programs in K-12 and higher education and a PhD program in higher education. So can I tell my students with certainty what they will make as higher education professionals? No. But is some information better than none? I think so.

A First Look at Program-Level Earnings Data by Credential Level

The U.S. Department of Education has been promising program-level earnings data in the College Scorecard for several months now following the release of program-level debt data back in May. Debt data are interesting, but I think everyone was waiting for earnings data to come out. And it came out today, sending me scrambling to get into the data in between meetings, teaching, and other responsibilities of a tenured faculty member. The data can be found here, and please do read the documentation before digging into the data.

Before I get back to meetings, here are a few takeaways:

(1) Debt and earnings data are based on different samples of students. Debt data only include people with federal loans, while earnings data include people with any type of financial aid. At community colleges, these samples are quite different because more students typically get Pell Grants than loans. But for graduate programs, the numbers really only differ by a few work-study students.

(2) Most programs aren’t covered in the data, but most students are. For the most recent data file, there are 216,638 programs listed. Of these programs, 45,371 have earnings data and 51,423 have debt data.

(3) Earnings data are soon after graduation. Earnings were measured in 2016-17 for students graduating in 2014-15 and 2015-16. More years of data will be included in the future.

(4) Want to make money? Be a dentist. The program with highest earnings was (The) Ohio State University’s dental program, with earnings of $231,200 and debt of $173,309. Dental and other health sciences programs dominated the top of the earnings distributions, with a few law and business programs thrown in. Most of these programs have high debt burdens. On the other hand, Parker University’s chiropractic program brought up the rear with debt of $193,328 and earnings of $2,700. Something strange is probably going on with the data there.

(5) Earnings and debt vary considerably by credential level. In general, both debt and earnings increase across credential levels, but debt increases at a higher rate. As shown below, the median debt-to-earnings ratio across first professional (law, medicine, etc.) programs was 191%. Earnings often increase quickly in future years, but the first few years won’t be fun.

I look forward to seeing a whole host of (responsible) analyses using the new data, so keep me posted of any good takes. This has the potential to influence families and colleges alike, and I’m particularly interested to see if the data release affects whether colleges close low-performing programs (as I discussed in my last blog post).

Some Thoughts on Program-Level College Scorecard Data

The U.S. Department of Education has been promising to make program-level outcome data available on the College Scorecard for several years now. The Obama administration started the underlying data collection after releasing the initial Scorecard to the public in 2015, and the Trump administration elevated this topic by issuing an executive order earlier this year. I was at a technical review panel at ED last month on this topic, and I just noticed earlier today that members of the public can now comment on our two-day discussion in one of Washington’s most scenic windowless conference rooms.

So I was surprised to see a press release this afternoon announcing that the College Scorecard had been updated in several important ways. This update includes more than just program-level data. The public-facing site now has data on certificate-granting institutions, as well as using IPEDS data on graduation rates that go beyond first-time, full-time students. Needless to say, I’m happy to see both of these improvements, even though I am somewhat skeptical that students pursuing vocational certificates will access the public-facing Scorecard to the same extent that students seeking bachelor’s degrees will.

But this blog post focuses on program-level Scorecard data, which are preliminary and will be updated as soon as later this year. I used the combined 2015-16 and 2016-17 dataset (the most recent year available), which includes data on all graduates who received federal financial aid. This means that coverage is better for certain programs than others; for example, law schools are better covered than PhD programs since relatively few PhD students borrow compared to law students. The dataset contains 194,575 programs across 6,094 institutions.

Here are some highlights:

  • Median debt data are only available for 42,430 programs (21.8% of the sample), as small programs do not have data shown due to privacy concerns. But based on IPEDS completions, about 70% of students are enrolled in programs where debt data are available.
  • Here are the average median debt burdens by credential level:
    • Undergraduate certificate: $10,953 (n=4,146)
    • Associate: $15,134 (n=5,952)
    • Bachelor’s: $23,382 (n=23,649)
    • Graduate certificate: $48,513 (n=266)
    • Master’s: $42,335 (n=7,011)
    • First professional: $141,310 (n=660)
    • Doctoral: $95,715 (n=716)
  • 172 programs had over $200,000 in median debt, and it looks like the top 116 programs are all in health sciences. The data are preliminary, but Roseman University of Health Sciences’s dentistry program has the top listed debt burden at a cool $410,213. Meanwhile, 3,970 programs had median debt burdens below $10,000.

I am thrilled to see program-level debt data, both as a researcher (if I only had more time to sit down and dive into the data!) and as the newly-minted director of higher education graduate programs. Thanks to this dataset, I now know that roughly half of the students in the educational leadership doctoral program (K-12 and higher ed) at Seton Hall borrow, and median debt among graduates is $63,045. I hope that colleges around the country use this tool to get a handle on their graduates’ situations now that data are available for more than just those programs that were covered by gainful employment.

Oh, and about gainful employment. Once earnings data come out (which hopefully will be soon), it will be possible to calculate a debt-to-earnings ratio for programs that cover a large number of students even without the sanctions present in the now-mothballed gainful employment regulations. Also expect to see loan repayment rates in the updated Scorecard, which will shed some interesting light on income-driven repayment rate usage and the implications for students and taxpayers.