Trends in Federal Student Loan and Pell Grant Awards

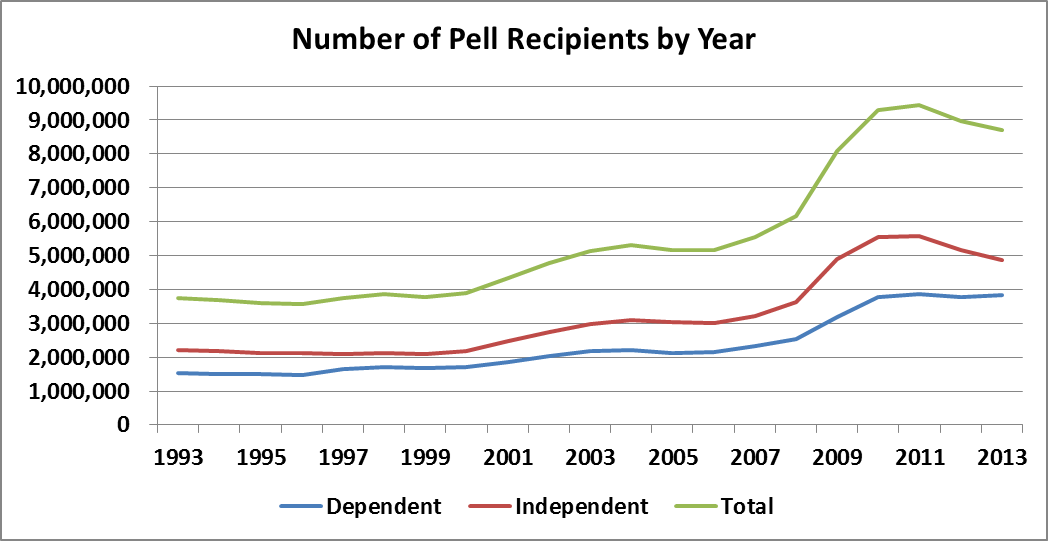
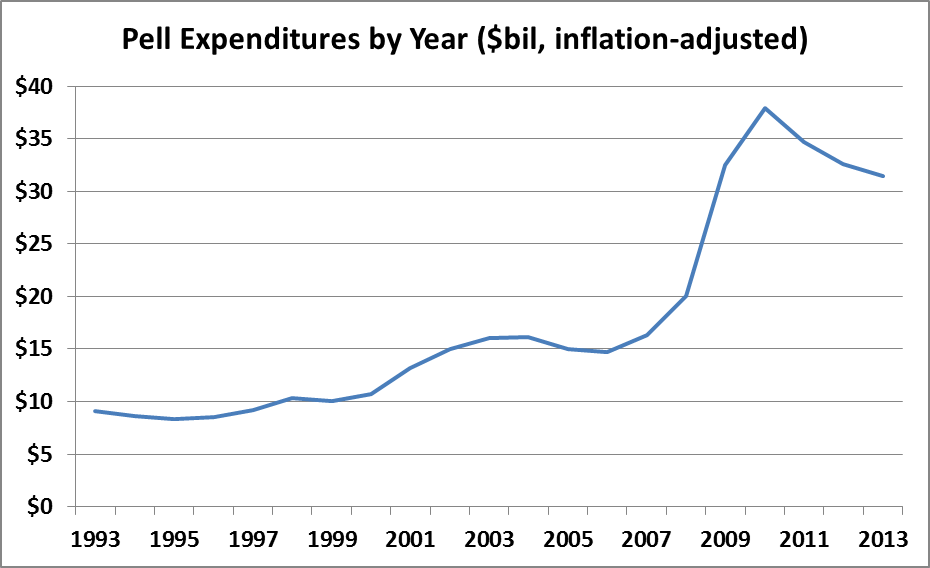
The U.S. Department of Education’s Office of Federal Student Aid released its newest quarterly update on federal student loan and Pell Grant awards on Friday, and the data (through the end of the 2014-15 academic year) are nothing short of stunning. As shown in the table below, federal student loan volume dropped by nearly $11 billion in 2014-15 to $89.4 billion, the lowest level since before the federal government ended the old bank-based lending program in 2010. Total Pell Grant awards also declined in 2014-15 to $30.3 billion, more than $5 billion below 2010-11 levels. (For more on trends in Pell awards over the last two decades, see my recent post on the topic.)

aid

What could explain such sharp drops in student loan and Pell Grant dollars? Four factors could be at work:

(1) As America slowly continues to climb out of the Great Recession, more students and families may be earning enough money not to qualify for Pell Grants or need to borrow as much in student loans. Unemployment rates are down sharply since 2010, but median real household income has been nearly flat—so this is probably a minor contributing factor.

(2) Americans may be less willing to borrow for college than they were a few years ago, leading to less student loan debt. I’m more concerned about undergraduate students underborrowing for college than overborrowing, particularly as students react to stories about other people’s (atypical) debt loads and concerns about their financial strength. But this is difficult to prove empirically given current data.

(3) Part of the decline in total Pell awards is likely due to changes in the FAFSA formula that reduced the number of students automatically receiving the maximum Pell Grant in 2012-13 and beyond. But this would not explain continued declines in Pell dollars received.

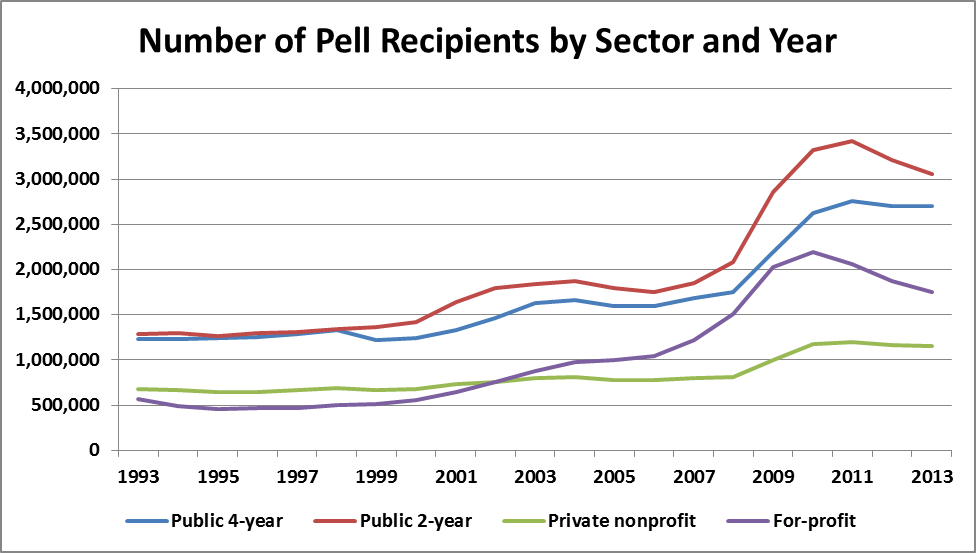
(4) The most likely explanation to me is decreased enrollment due to an improved labor market inducing some individuals to work instead of attend college combined with the collapse of some of the large for-profit college chains. The most up-to-date data from the National Student Clearinghouse (which is available well ahead of federal estimates) show that enrollment has declined at degree-granting colleges each of the past three years, with the largest declines taking place at community colleges and in the for-profit sector. Lower enrollment, particularly among adult students, leads to fewer students taking out loans and receiving Pell Grants.

As the economy continues to slowly strengthen and the for-profit sector continues to sort itself out, I would expect enrollment (and the number of students receiving Pell Grants) to very slowly increase over the next several years. Future trends in student loan debt are less clear. Given the explosion of students enrolling in income-based repayment programs, students (particularly in graduate programs) might have less of an incentive to keep loan amounts in check. Yet, to this point, there doesn’t seem to be a boom in graduate school loans across the board. It would be worth looking at particular colleges with large programs in fields that are especially likely to qualify for Public Service Loan Forgiveness to see if loan amounts there are up by large amounts.

Comments on Senator Clinton’s Higher Education Proposal

Hillary Clinton’s presidential campaign released her framework for higher education reform at midnight on Monday morning (see details here and here). The plan, officially listed at a cost of $350 billion over ten years, would move closer to the idea of debt-free public college, require states to increase their spending on public higher education, and potentially embrace some accountability reforms with bipartisan appeal. Below are some of my first-take comments on Sen. Clinton’s proposal, as I look forward to seeing complete details. (I didn’t get an embargoed copy in advance.)

  • This proposal feels like a direct reaction to pressure that Sen. Clinton was facing from the political Left. Both of her main rivals, independent Senator Bernie Sanders of Vermont and former Maryland Governor Martin O’Malley, have supported versions of debt-free public college plans. This has zero chance of passing Congress as is, particularly as the House of Representatives is likely to stay in Republican hands through 2020 and the proposal would be paid for by additional taxes on wealthy Americans.
  • I’m highly skeptical of the $350 billion price tag, or at least when it’s phrased as just being $35 billion per year (roughly equal to federal Pell Grant spending). New federal programs take several years to phase in, meaning that most of the expenses are in later years. (President Obama’s free community college proposal is similar.) Once this plan is fully in place, I’d expect the price tag to be closer to $70 billion per year. All politicians like to massage the ten-year budget window used for cost estimates, and Sen. Clinton is no different.
  • Unlike some other “free college” proposals, Sen. Clinton’s proposal brings at least some private nonprofit colleges to the table by potentially making some of their students eligible for additional aid. This is a politically smart move, as the private nonprofit lobby is strong and many colleges in this sector do good work for students. But as noted in Inside Higher Ed this morning, the leadership of the private college lobby is concerned about any proposals that direct relatively less money to private colleges—as it could affect some institutions’ ability to survive.
  • This plan includes a federal/state partnership, which is typical for Democratic higher education proposals (and a good way to keep the price tag down somewhat). However, as suggested by Medicaid, many Republican governors may not take up the extra funds in exchange for having to assume additional responsibilities. For that reason, Sen. Clinton’s proposal to allow public colleges in those states to bypass the state governments to work directly with the federal government is politically brilliant. But states probably won’t be happy.
  • Much of the price tag will go to reduce interest rates on student loans, both for current students and to allow former students to refinance their loans. This is a big deal for the Elizabeth Warren faction of the Democratic Party—the folks who really make their voices heard in primary elections. But this money will do little to improve access and completion rates, in part because much of the money goes to students after they have left college and because income-based repayment plans make interest rates less relevant. Additionally, students who tried to avoid debt as much as possible (many from lower-income families) won’t benefit as much and may be upset by the subsidies going to higher-income borrowers. I wrote about this in my previous post.
  • There are bipartisan pieces in this plan, including accreditation reform, better consumer information, and risk-sharing for student loans. If Sen. Clinton becomes the nominee, look for her to pivot to the center and highlight some of these proposals.
  • The Clinton staff are claiming this proposal will help bring down the cost of providing a college education, in addition to the price that students pay. I just can’t help but be skeptical when suggested cost-saving areas include administration and technology. Colleges have been facing pressure to tighten their belts for years from states (and many have actually done so), so I don’t think the federal government will be any more successful. But it makes for a good soundbite.

The three main Democratic candidates have now laid out their higher education agendas. Hopefully, the Republican field (which, with the exception of Sen. Marco Rubio, have been fairly quiet on the issue) will follow suit.

Why “Debt-Free” College Will Upset Some Students

In a major higher education policy proposal, former Senator and current Democratic presidential frontrunner Hillary Clinton recently announced plans for higher education reforms that come close to debt-free college by increasing grant aid to students and reducing interest rates on current loans. She is following in the footsteps of the other two main candidates for the Democratic nomination—Vermont independent senator Bernie Sanders and former Maryland governor Martin O’Malley—both of whom have called for some sort of debt-free higher education option.

Putting aside the substantial cost to federal taxpayers ($350 billion over 10 years) and state governments (unknown at this point) for a while, any plan for student loan reforms or debt-free college should make those who know the burden of student loan debt happy. Right? Perhaps not so much. A somewhat similar example comes out of Seattle, where credit card processor Gravity Payments announced earlier this year that its employees would be paid a minimum of $70,000 per year. Again, this is an idea that sounds great—essentially double the wages received by lower-level employees and get an outpouring of good publicity. However, although Gravity signed up a number of new customers, the company has faced some unexpected opposition.

As detailed in a recent New York Times article, Gravity lost a number of existing customers over fears that increasing wages would result in higher future charges, even though the CEO cut his salary to partially pay for the wage increases. That doesn’t really have a corollary to higher education, but the other key point in the article does. Gravity lost two employees making over $70,000 per year as a result of the wage increase for everyone else, as they did not feel valued in a company that paid lower-skilled workers similar amounts to what they earned.

This raises an important point—whenever a program such as a dramatically higher wage floor, student loan reforms that reduce borrowing costs, or debt free college is introduced, at least some similar people who do not qualify for the new program are likely to be upset. Consider the case of a student who just finished repaying $15,000 in student loans by making additional payments in order to become debt-free as soon as possible. She may have sacrificed by working additional hours while in college, attending a less-selective college, and forgoing buying a newer, more reliable car. If the terms on student loan debt change in a way that essentially reward a student who borrowed $35,000 in order to not work in college and enjoy a slightly higher standard of living, it’s reasonable to expect the student with less debt to be upset. (Let’s also not forget the group of lower-income students who are debt-averse and will do anything not to borrow for college. They wouldn’t benefit from any student loan reforms.)

A move to debt-free college works in a similar way, as students who go to college after such a program is instituted get to benefit, while students who attended a few years earlier get nothing. This is happening to some extent in states like Tennessee, where all students can go to a community college tuition-free, and there is no constitutional amendment saying that life must be fair for all. But when plans for debt-free college and reducing student loan burdens get introduced, let’s not forget that some people will get upset because they perceive themselves as getting the short end of the stick. And when presidential campaigns try to build up support, they should do everything they can to make this group happy.

Analyzing Trends in Pell Grant Recipients and Expenditures

This post first appeared at the Brookings Institution’s Brown Center Chalkboard blog.

The U.S. Department of Education recently released its annual report on the federal Pell Grant program, which provides detailed information about the program’s finances and who is receiving grants. The most recent report includes data from the 2013-14 academic year, and I summarize the data and trends over the last two decades in this post.

For the second year in a row, the number of Pell recipients fell, going from a peak of 9.44 million students in 2011-12 to 8.66 million in 2013-14. This drop in recipients is almost entirely due to students who are considered independent for financial aid purposes (typically students who are at least 24 years of age, are married, or have a child). The number of independent Pell recipients fell by 13% in the last two years (to 4.87 million), while the number of dependent Pell recipients fell by just 27,000 students to 3.83 million, as shown in the chart below.

pell2015_fig1

Why has the number of Pell recipients declined over the past two years after such a sharp increase between 2008 and 2010? Two factors are at play. First, enrollment at vocationally-oriented colleges (primarily community colleges and for-profit colleges) increases during recessions as displaced workers choose to receive additional training instead of trying to find a job in an awful economy. When the economy gets better, more of these individuals go back to work and forgo college. Second, as the economy has improved, it is likely the case that some families that barely qualified for the Pell Grant during the recession no longer qualified after obtaining a better job.

The next chart shows that the decline in the number of Pell recipients over the last two years is largely due to community colleges and for-profit colleges. The number of Pell recipients at community colleges has declined by 11% since 2011-12, while the number at for-profit colleges has declined by 20% since 2010-11 after more than doubling in the previous five years. This is consistent with enrollment at some of the largest for-profit chains cratering in the last few years due to both the colleges’ actions (such as the University of Phoenix enacting a trial period for students) and actions from regulators (as evidenced in the recent collapse of Corinthian Colleges).

pell2015_fig2

Expenditures for the Pell Grant program declined for a third consecutive year, going from $35.7 billion (in nominal dollars) in 2010-11 to $31.5 billion in 2013-14. However, in inflation-adjusted dollars, Pell spending has still more than doubled since 2007-08.

pell2015_fig3

The big spike in Pell expenditures around 2009 was due to three factors. First, the start of the Great Recession both induced more students to enroll in college and resulted in more students with financial need who met the Pell Grant eligibility criteria. Second, changes to federal laws that took effect in 2009-10 increased the maximum Pell Grant by over $600 and allowed more students to automatically qualify for the maximum Pell Grant by increasing the income threshold (from $20,000 to $30,000) for an automatic zero expected family contribution. Third, students were allowed to receive a Pell Grant on a year-round basis instead of just two semesters during the academic year, driving up short-term costs but potentially helping students complete their studies quicker. In 2011, the year-round Pell provision was repealed and the income threshold for an automatic zero EFC dropped to $23,000 as cost-saving measures. Congress has shown bipartisan interest in allowing year-round Pell again, but changing the income threshold for an automatic zero EFC appears to be off the table for now.

The final chart shows the maximum Pell Grant award (in inflation-adjusted dollars) between 1993-94 and 2013-14. Contrary to what many might expect, the maximum award has increased from $3,696 in 1993-94 to $5,645 today; the average award has also increased from $2,419 to $3,634. But the increase in the Pell Grant’s real value has not kept up with the increasing price of college in all sectors of higher education. As a result, its purchasing power has fallen by two-thirds since 1979.

pell2015_fig4

For those who are interested in learning more about how much in Pell Grant revenue individual colleges receive, I highly recommend the Title IV program volume reports available on Federal Student Aid’s website. In addition to Pell Grant revenue, this site has information on student loan awards going back to the 1999-2000 academic year.

Examining Trends in Living Allowances for College

The National Center for Education Statistics released a new report and data on trends in the cost of attendance for different types of colleges, including data from the 2012-13 to 2014-15 academic years. The report shows that, among colleges operating on a traditional academic year basis (excluding most vocationally-oriented colleges), tuition and fees generally increased at a rate faster than inflation among public and private nonprofit colleges over the last two years. However, tuition failed to keep up with inflation in the for-profit sector and allowances for other living expenses (such as transportation and laundry) declined over the past two years after taking inflation into account.

I dug deeper into the data, looking at the percentage of colleges by sector that increased, decreased, or held constant each of the cost of attendance components (tuition/fees, room and board, books and supplies, and other living expenses) between 2013-14 and 2014-15—without adjusting for inflation. I focused on students living off-campus without their family, as colleges have the ability to determine the room and board allowance but do not directly receive any housing revenue for off-campus students. (My blog post on the topic last year ended up connecting me to Braden Hosch at Stony Brook and Sara Goldrick-Rab at Wisconsin-Madison, and we’ve dug deeper into the accuracy and consistency of these estimates in a working paper.)

The results (below) show that for-profit colleges were far more likely to lower tuition and fees than public or private nonprofit colleges. While 75% of public colleges and 85% of private nonprofits increased tuition, just 42% of for-profit colleges did so. For-profits were also more likely to lower books/supplies and other living expense allowances, although the typical allowance was still higher than for nonprofit colleges. A majority of colleges across sectors increased room and board, while most colleges did not change their allowances for books and supplies.


Table 1: Changes in COA components by sector, 2013-14 to 2014-15.
Private nonprofit
Characteristic (2014-15) Public For-profit
Cost of attendance, students living off-campus without family
  Median ($) 18,328 37,900 28,796
  Increased from 2013-14 (pct) 77.8 84.9 56.3
  No change from 2013-14 (pct) 7.2 5.8 8.2
  Decreased from 2013-14 (pct) 15.0 9.3 35.5
Tuition and fees
  Median ($) 4,200 24,670 14,040
  Increased from 2013-14 (pct) 74.9 84.6 42.3
  No change from 2013-14 (pct) 19.5 11.0 38.5
  Decreased from 2013-14 (pct) 5.7 4.4 19.2
Room and board
  Median ($) 8,280 9,000 7,574
  Increased from 2013-14 (pct) 55.1 56.4 59.2
  No change from 2013-14 (pct) 34.6 34.5 28.2
  Decreased from 2013-14 (pct) 10.4 9.2 12.5
Books and supplies
  Median ($) 1,265 1,200 1,380
  Increased from 2013-14 (pct) 37.8 23.1 25.7
  No change from 2013-14 (pct) 54.4 69.3 59.1
  Decreased from 2013-14 (pct) 7.8 7.6 15.2
Other living expenses
  Median ($) 3,742 3,150 5,000
  Increased from 2013-14 (pct) 42.0 35.1 35.5
  No change from 2013-14 (pct) 36.8 48.9 27.4
  Decreased from 2013-14 (pct) 21.2 16.0 37.1
Number of colleges 1,573 1,233 719
SOURCE: Integrated Postsecondary Education Data System.
Note: Limited to colleges reporting costs on an academic year basis.

Yet as was noted in last year’s blog post on this topic, some colleges set room and board allowances that are unreasonably low by any standard. This year, I focused on the 27 colleges that reduced their room and board allowance for off-campus students by at least $3,000 between 2013-14 and 2014-15. Some of the changes may be reasonable, such as Thomas University’s drop from $15,200 to $10,530 for nine months of room and board. But many others are unlikely to meet any standard of reasonableness. For example, Emory & Henry College in Virginia reduced its allowance from $11,800 for nine months to just $3,000, while the College of DuPage in Illinois cut its allowance from $8,257 to $2,462. Good luck trying to rent an apartment and eating ramen on that budget!

Table 2: Colleges with large declines in off-campus room and board allowances, 2013-14 to 2014-15.
Name State 2013-14 2014-15 Change
Emory & Henry College VA 11,800 3,000 -8,800
Atlanta Metropolitan State College GA 10,753 3,160 -7,593
Mount Carmel College of Nursing OH 13,392 6,380 -7,012
Vanguard University of Southern California CA 11,286 4,600 -6,686
Louisiana Delta Community College LA 15,322 8,789 -6,533
Trinity College of Nursing & Health Sciences IL 12,346 5,858 -6,488
Arkansas Northeastern College AR 11,969 6,102 -5,867
College of DuPage IL 8,257 2,462 -5,795
College of the Mainland TX 11,330 5,665 -5,665
Randolph-Macon College VA 9,200 3,650 -5,550
The University of Texas at Brownsville TX 11,495 6,250 -5,245
SAE Institute of Technology-Nashville TN 15,000 10,000 -5,000
Bon Secours Memorial College of Nursing VA 15,000 10,000 -5,000
Thomas University GA 15,200 10,530 -4,670
Davenport University MI 8,692 4,340 -4,352
Southwestern Illinois College IL 8,516 4,280 -4,236
Lee University TN 11,650 7,520 -4,130
Grace School of Theology TX 12,684 8,584 -4,100
Prairie View A & M University TX 11,289 7,197 -4,092
NY Methodist Hospital Center for Allied Health Education NY 17,568 13,496 -4,072
College of Business and Technology-Flagler FL 12,000 8,320 -3,680
College of Business and Technology-Miami Gardens FL 12,000 8,320 -3,680
Anoka Technical College MN 10,356 6,994 -3,362
Central Penn College PA 6,855 3,500 -3,355
St Margaret School of Nursing PA 9,960 6,640 -3,320
Fortis Institute-Port Saint Lucie FL 12,732 9,495 -3,237
Southern California Seminary CA 14,616 11,493 -3,123
SOURCE: Integrated Postsecondary Education Data System.
Note: Limited to colleges reporting costs on an academic year basis.

Why do some colleges feel pressures to cut back living allowances? It’s all about accountability. The amount of loan dollars students can borrow is limited by the cost of attendance, meaning that reducing living allowances (and hence the cost of attendance) reduces borrowing—and potentially the risk of a college facing sanctions for high student loan default rates. The cost of attendance also determines the net price (the COA after grants are applied), an important accountability metric. Since colleges don’t directly benefit financially from a higher off-campus living allowance, they have an incentive to reduce the living allowance while continuing to increase tuition.

New Evidence on the Bennett Hypothesis and Federal Student Aid

One of the eternal debates in higher education policy is the validity of the Bennett Hypothesis, first stated by William Bennett (President Reagan’s Secretary of Education) in 1987:

“If anything, increases in financial aid in recent years have enabled colleges and universities blithely to raise their tuitions, confident that Federal loan subsidies would help cushion the increase. In 1978, subsidies became available to a greatly expanded number of students. In 1980, college tuitions began rising year after year at a rate that exceeded inflation. Federal student aid policies do not cause college price inflation, but there is little doubt that they help make it possible.”

Does the availability of federal financial aid give colleges an incentive to keep hiking tuition? I wrote about the existing research on the Bennett Hypothesis last fall, which has been one of the most-read posts in my three years of blogging. At that time, I concluded that although it’s quite possible that federal financial aid is associated with increased tuition, it was hard to draw a solid conclusion given data limitations and the fact that nearly all students can receive federal financial aid—limiting the ability to draw causal inferences.

But two recent studies have pushed the research frontier forward by estimating the relationship between small changes in federal aid and colleges’ pricing strategy. The first is a job market paper by Christopher Lau, a recent economics PhD graduate from Northwestern. Using a rather complicated analytic strategy (read the methods section and see for yourself!), he estimated that for-profit colleges captured approximately 57 cents of each additional dollar of federal grant aid and 51 cents of each additional dollar of federal loan aid. Community colleges captured a smaller portion of federal aid dollars (37% of grant aid and 25% of loan aid), which is unsurprising given that the maximum Pell Grant is larger than community college tuition in nearly all states. Additionally, states often limit the amount that public colleges can increase tuition, reducing the opportunity for strategic behavior.

The second examination of the Bennett Hypothesis is a newly released report from three economists at the New York Fed. They used increases to federal subsidized and unsubsidized loan limits in 2007 as well as maximum Pell Grant awards to see whether colleges responded by increasing tuition. They found that colleges did increase posted tuition (not necessarily net tuition) at a higher rate after loan limits increased, with the magnitude being approximately 55 cents for each dollar of additional Pell Grant aid and 65 cents for each dollar of subsidized loan aid. These effects were largest for the most expensive private nonprofit colleges, where the maximum amount of federal loans ($5,500 for a first-year student) only covers a small portion of tuition.

An even more interesting finding from the Fed paper is that shareholders in for-profit colleges responded favorably to the passage of legislation that increased federal financial aid amounts. They concluded that across three pieces of legislation, the cumulative increase in stock prices was about 10% above what would have been expected without an increase. Given the high (at the time) public valuations of large publicly traded for-profits, this represented a large increase in valuation. It is also worth noting that because for-profits have to get at least 10% of their revenue from non-federal sources or veteran’s benefits, some colleges may have had to increase tuition in order for students to take out private loans to stay clear of the so-called ‘90/10’ rule.

Both of these papers have some major limitations. Most notably, they are unable to account for whether students took out less in PLUS or private loans when subsidized loans and Pell Grants increased and do not look at net tuition after grant aid. However, these represent some of the best evidence of there being some truth to the Bennett Hypothesis for the most expensive colleges. But does this lend credence to the claim that tuition will become much less expensive if the federal government got out of the student aid business? As a researcher, I urge caution with that interpretation for two reasons. First, these studies only tell us what happens when more aid goes into the system. The relationship may not hold when less aid comes in. Second, these findings are based on relatively small changes in aid—often less than $1,000. These ‘local’ effects may not hold for a larger change.

What if College Amenities Were Unbundled?

Recent articles by Jeff Selingo in the Washington Post and Matt Reed in Inside Higher Ed have address the idea of “unbundling” college credits. Selingo contends in his piece that two of the reasons why students pay so much for college is that they face the same price if taking 12 or 15 credits per semester (true at many colleges) and that colleges don’t always accept transfer credits in an effort to generate revenue (probably true, but difficult to prove). Reed notes an important distinction regarding transfer credits—although students may get credit for a community college course at a four-year institution, the credit might be granted as an elective that still requires the student to take the course over again.

Both Selingo and Reed refer to the push to allow consumers to unbundle their cable packages as a potential example of what to do (or not to do) in higher education. Currently, consumers have to choose a bundle of channels in order to get the particular channel or two they are the most interested in actually watching. A recent report estimated that cable companies paid an average of $6.04 per month to carry ESPN—and this gets passed along to consumers regardless of whether they actually want to watch the channel. Verizon has recently allowed subscribers to choose what types of channels they want to pay for, and Disney (the owner of ESPN) promptly sued to maintain the bundle. Disney’s fear is that maybe only half of the subscribers would pay $6 per month for ESPN, meaning that the price would have to double in order to match the previous revenue—at which point more customers would likely opt out.

Higher education offers similar examples of bundling that would quite possibly be brought down if students had the choice to select their preferred options. At many colleges, amenities such as recreation centers and intercollegiate athletics programs are funded through mandatory student fees. For example, the typical Big Ten Conference university charges students about $150 per semester in fees to fund recreational activities, regardless of whether a student actually chooses to use any facilities. While students often vote to approve the initial imposition of the fee, students who enroll in later years still have to pay the fee even if they would not have voted for it in the first place.

Fees for supporting intercollegiate athletics can be over $1,000 per year at some colleges, particularly at institutions without large donor bases or other revenue sources. An example is Longwood University in Virginia, which charges $239 per credit hour in tuition alongside over $63 per credit in athletics fees. This means that Longwood students taking 120 credits would be paying about $7,500 to subsidize athletics during their time on campus, something which many students might opt out of it they had a chance.

Higher education could be unbundled in other ways, including removing any requirements that students live on campus or purchase a meal plan, ending provisions requiring students to complete a certain number of credits in residency, or even potentially through the encouragement of open courseware that does not require an expensive subscription through the college. But any such efforts to unbundle will take away important revenue sources, so expect colleges to compensate in any way that they can. There is value in some of the bundling requirements, to be sure—for example, campus mental health services may not be offered if students had to opt into paying for the ability to access services. But it is worth having a conversation about what should be bundled and what should be provided on an a la carte basis.

Why ASAP Could Harm Some Students

The City University of New York’s Accelerated Study in Associate Programs (ASAP) has gotten a great deal of positive attention in the last few years, and for good reason. The program provides much-needed additional economic, advising, and social supports to community college students from low-income families, and a new evaluation of a randomized trial from MDRC found that ASAP increased three-year associate’s degree completion rates from 22% in the control group to 40% in the treatment group. I’m glad to see that the program will be expanded to three community colleges in Ohio, as this will help address concerns about the feasibility of scaling up the program to cover more students.

But it is important to recognize that ASAP, as currently constituted, is limited to students who are able and willing to attend college full-time. Full-time students are the minority at community colleges, and full-time students tend to be more economically and socially advantaged than their part-time peers. As currently constructed, ASAP would direct a higher percentage of resources to full-time students, even though part-time students likely need support more than full-time students. (However, it’s worth noting that although part-time students count in some states’ performance-based funding systems, they are currently not counted in federal graduation rate metrics.)

Students in ASAP also get priority registration privileges, which can certainly contribute to on-time degree completion. But it is not uncommon for classes (at least at desirable times) to have waiting lists, meaning that ASAP students get access to courses while other students do not. If a part-time student cannot get access to a course that he or she needs, it could mean that the student is forced to stop out of college for a semester—a substantial risk factor for degree completion.

ASAP has many promising aspects, but further study is needed to see if the degree completion gains for full-time students are coming at the expense of part-time students. Some of the ASAP services should be extended to all students, and priority registration should be reconsidered to benefit students who are truly in need to getting into a course instead of those who are able to attend full-time.

Why I’m Conflicted About College Athletics

As a college professor doing research in higher education finance and accountability policy, there are many times when my enjoyment of college athletics leaves me conflicted. I enjoy watching my beloved Wisconsin Badgers get the best of (most of) their Big Ten opponents on a regular basis, but I also recognize that at all but the few dozen wealthiest universities, college athletics are heavily subsidized by student fees. (Answering whether athletics programs are actually profitable is very difficult due to concerns with cost allocations, assumptions about whether students are induced to attend because of athletics, and how revenue is disbursed.)

In the past year, colleges in the “Power Five” athletic conferences (Big Ten, Big 12, Atlantic Coast, Pacific-12, and Southeastern Conferences) gained additional autonomy from the rest of the NCAA. They then voted to increase athletic scholarships by $2,000-$4,000 per year per athlete to cover the full cost of attendance, which is definitely a good thing for those athletes. Other Division I colleges can choose to also increase scholarships, but not without significant budgetary implications. For a college with 250 scholarship athletes (not an unrealistic number for a college with football), the cost could approach one million dollars per year. My concern is that those increases are likely to be funded out of the pockets of students and/or by cutting non-revenue sports like wrestling and track and field.

Other things that college athletic programs do are unambiguously bad for athletes. A recent example of this is with national letters of intent, which bind athletes to a college at the end of the recruiting process. Earlier this month, prized linebacker recruit Roquan Smith made news by accepting a football scholarship from the University of Georgia (switching from UCLA) without signing the letter of intent. Once a letter is signed, a student cannot transfer without losing eligibility unless the college decides to let the student out. In the meantime, coaches often leave for other jobs without facing any employment restrictions.

As a professor, I also worry about the increased number of televised weeknight games long distances from campus that cause athletes difficulties attending class. It’s great to get exposure for your college on national television (and get serious television dollars), but this places a burden on athletes and faculty who work with those students. But if I’m not teaching one evening and a good game is on, will I watch it? Quite possibly. Should I? No.

I’m curious to get readers’ thoughts about how they manage the pros and cons of big-time college athletics. Even when the game is going on, I can’t help think about the students and the dollar signs behind them.

[NOTE: A previous version of the post incorrectly noted that Mr. Smith was intending to enroll at UCLA instead of the University of Georgia. Thanks to Ed Kilgore for pointing out this error.]

The FY 2016 Obama Budget: A Few Surprises

The Obama Administration released their $3.999 trillion budget proposal for Fiscal Year 2016, and the higher education portion of the budget was largely as expected. Some proposals, such as increasing research funding, providing a bonus pool of funds for colleges with high graduation rates, and reallocating the Supplemental Educational Opportunity Grant to be based on current financial need instead of an antiquated formula, were repeats from previous years. Others, such as the idea of tuition-free community college, had already been sketched out. And one controversial proposal—the plan to tax new 529 college savings plans—had already been nixed, but remained in the budget document due to a “printing deadline.”

But the budget proposal (the vast majority of which is dead on arrival in a GOP Congress thanks to differences in viewpoints and preferred budget levels) did have some surprising details. The three most interesting higher education-related details are below.

(1) “Universal” free community college isn’t exactly universal. Pages 59 and 60 of the education budget proposal noted that students with a family Adjusted Gross Income of over $200,000 would be ineligible for tuition-free community college. Although this detail was apparently decided before the program was announced, the Obama Administration for some reason chose to hide that detail from the public until Monday. As the picture shows below, only 2.7% of dependent community college students had family incomes above $200,000 in 2011-12 (data from the National Postsecondary Student Aid Study).

income

But in order to get family income, students have to file the FAFSA. Research by Lyle McKinney and Heather Novak suggests that 42% of low-income community college students didn’t file the FAFSA in 2007-08, meaning that something big needs to be done to get these students to file. Requiring the FAFSA also means that noncitizens typically would not qualify for free community college, something that is likely to upset advocates for “dreamer” students (but make many on the Right happy).

Additionally, as Susan Dynarski at the University of Michigan pointed out, the GPA requirements (a 2.5 instead of a 2.0) make a big difference. In 2011-12, 15.9% of Pell recipients had GPAs between a 2.0 and 2.49, meaning they would not qualify for free community college.

gpa


(2) Asset questions may be off the FAFSA. The budget document called for the following changes to the FAFSA, including the elimination of assets (thanks to Ben Miller at New America for the screenshot):

fafsa


Getting rid of assets won’t affect most families, as research by Susan Dynarski and Judith Scott-Clayton shows. But it does matter more to selective colleges, more of which might turn to additional financial aid forms like the CSS/PROFILE to get the information they want. Policymakers should take the benefits of FAFSA simplicity as well as the potential costs to students of additional forms into account.

(3) Mum’s the word on college ratings. After last year’s budget featured $10 million for the development of the Postsecondary Institution Ratings System (PIRS), this year’s budget had no mention. Inside Higher Ed reported that ratings will be developed using existing funds and using existing personnel. Will that slow down the development of ratings? Given the slow progress at this point, it’s hard to argue otherwise.

Finally, the budget document also contained details about the “true” default rate for student loans, using the life of the loan instead of the 3-year default window used for accountability purposes. The results aren’t pretty for undergraduate students, with default rates pushing 23% on undergraduate Stafford loans. But default rates for graduate loans hover around 6%-7%, which is roughly the interest rates many of these students face.

default


What are your thoughts on the President’s budget proposal for higher education? Please share them in the comments section.