I am a professor at the University of Tennessee, Knoxville who studies higher education finance, accountability policies and practices, and student financial aid. All opinions expressed here are my own.
I get asked a couple times every week by journalists or people working in higher education about the financial health of a particular institution. Interestingly enough, about half of the requests in the last year have been about America’s wealthiest universities and the other half are about colleges teetering on the brink of closure. In a K-shaped economy, that seems appropriate.
Endowment spending concerns are present at both ends of the wealth distribution, with the wealthiest institutions facing pressures to spend more to avoid large cuts driven by changes from Washington and the least wealthy institutions using their small endowments as a way to keep their doors open. The generally accepted principle is that colleges should spend between four and five percent out of their endowments each year to fund operations and scholarships; this honors donors’ intent while still allowing the endowment to grow. Spending rates could likely go up to six or even seven percent for a while and match long-term stock market returns, but that becomes risky in the event of a recession. It could take a decade or more to regain value if the stock market plummets, and small colleges do not have the luxury of time.
The most up-to-date source on endowment spending across higher education comes from the NACUBO-Commonfund Endowment Study. This source includes most large universities and a portion of smaller colleges, with Fiscal Year 2025 data being released last year. This paragraph from NACUBO’s press release caught my attention, as it shows increasing spending rates over the last few years and higher spending rates for the smallest private colleges.
This led me to dig into the endowment spending rates for private colleges using institution-level data from IPEDS. IPEDS added information on spending rates several years ago in response to requests from the field, which is a good example of how technical review panels used to work before the National Center for Education Statistics was nearly demolished by DOGE. IPEDS data are only available through Fiscal Year 2024, but it still provides useful insights into spending rates.
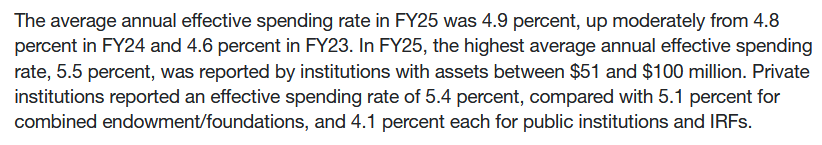
The figure below shows the distribution of FY24 endowment spending rates for 1,202 private nonprofit institutions with at least $1 million in their endowment at the end of that fiscal year. Forty percent of colleges spent between four and six percent of the beginning of the year endowment value, which is in line with general guidelines. However, eight percent of colleges spent more than ten percent and thirteen percent—disproportionately tiny institutions with endowments of less than $5 million—spent nothing at all.
To give an example of why endowment spending is a concern, look at Webster University in Missouri. In an interview with the Chronicle, I called their Fiscal Year 2023 results “a calamity,” which says something because I get asked about a lot of struggling colleges. But most colleges of that size do not manage to post a $40 million operating loss that shrinks the size of the endowment by more than one-third in just one year according to IRS Form 990 filings. IPEDS data showed a 39% spending rate in FY23 followed by a 32% spending rate in FY24. They still had about $66 million in their endowment at the end of FY24, but that is greatly diminished.
Overall, 43 colleges spent more than ten percent of their endowment value in both FY23 and FY24, which is certainly a warning sign. As usual, I compiled the data for this piece into a downloadable spreadsheet so you can look up spending rates for individual private colleges.
It has been a busy stretch for higher education data over the last month. December saw a release of financial aid, admissions, and graduation rate data through the Integrated Postsecondary Education Data System (IPEDS) and a substantial release of program-level debt and earnings data in advance of this week’s negotiated rulemaking sessions. The National Center for Education Statistics continued its efforts to release data with a limited staff by publishing an additional year of data on fall enrollment, staff, and finance this week—concluding the 2025-26 release cycle.
Given my research, it is no surprise that I was eagerly awaiting the most recent year of finance data (covering Fiscal Year 2024). While getting data about 18 months after fiscal years end is not terribly helpful to evaluate the condition of colleges teetering on the brink of closure, it is a useful metric of the (somewhat delayed) financial health of institutions.
For the last couple of years, I have taken a look at colleges that consistently lose money. I am continuing that trend with the newest year of data, but looking more broadly at losses across institutional sector (degree-granting institutions only, excluding Carnegie-designated special-focus institutions).
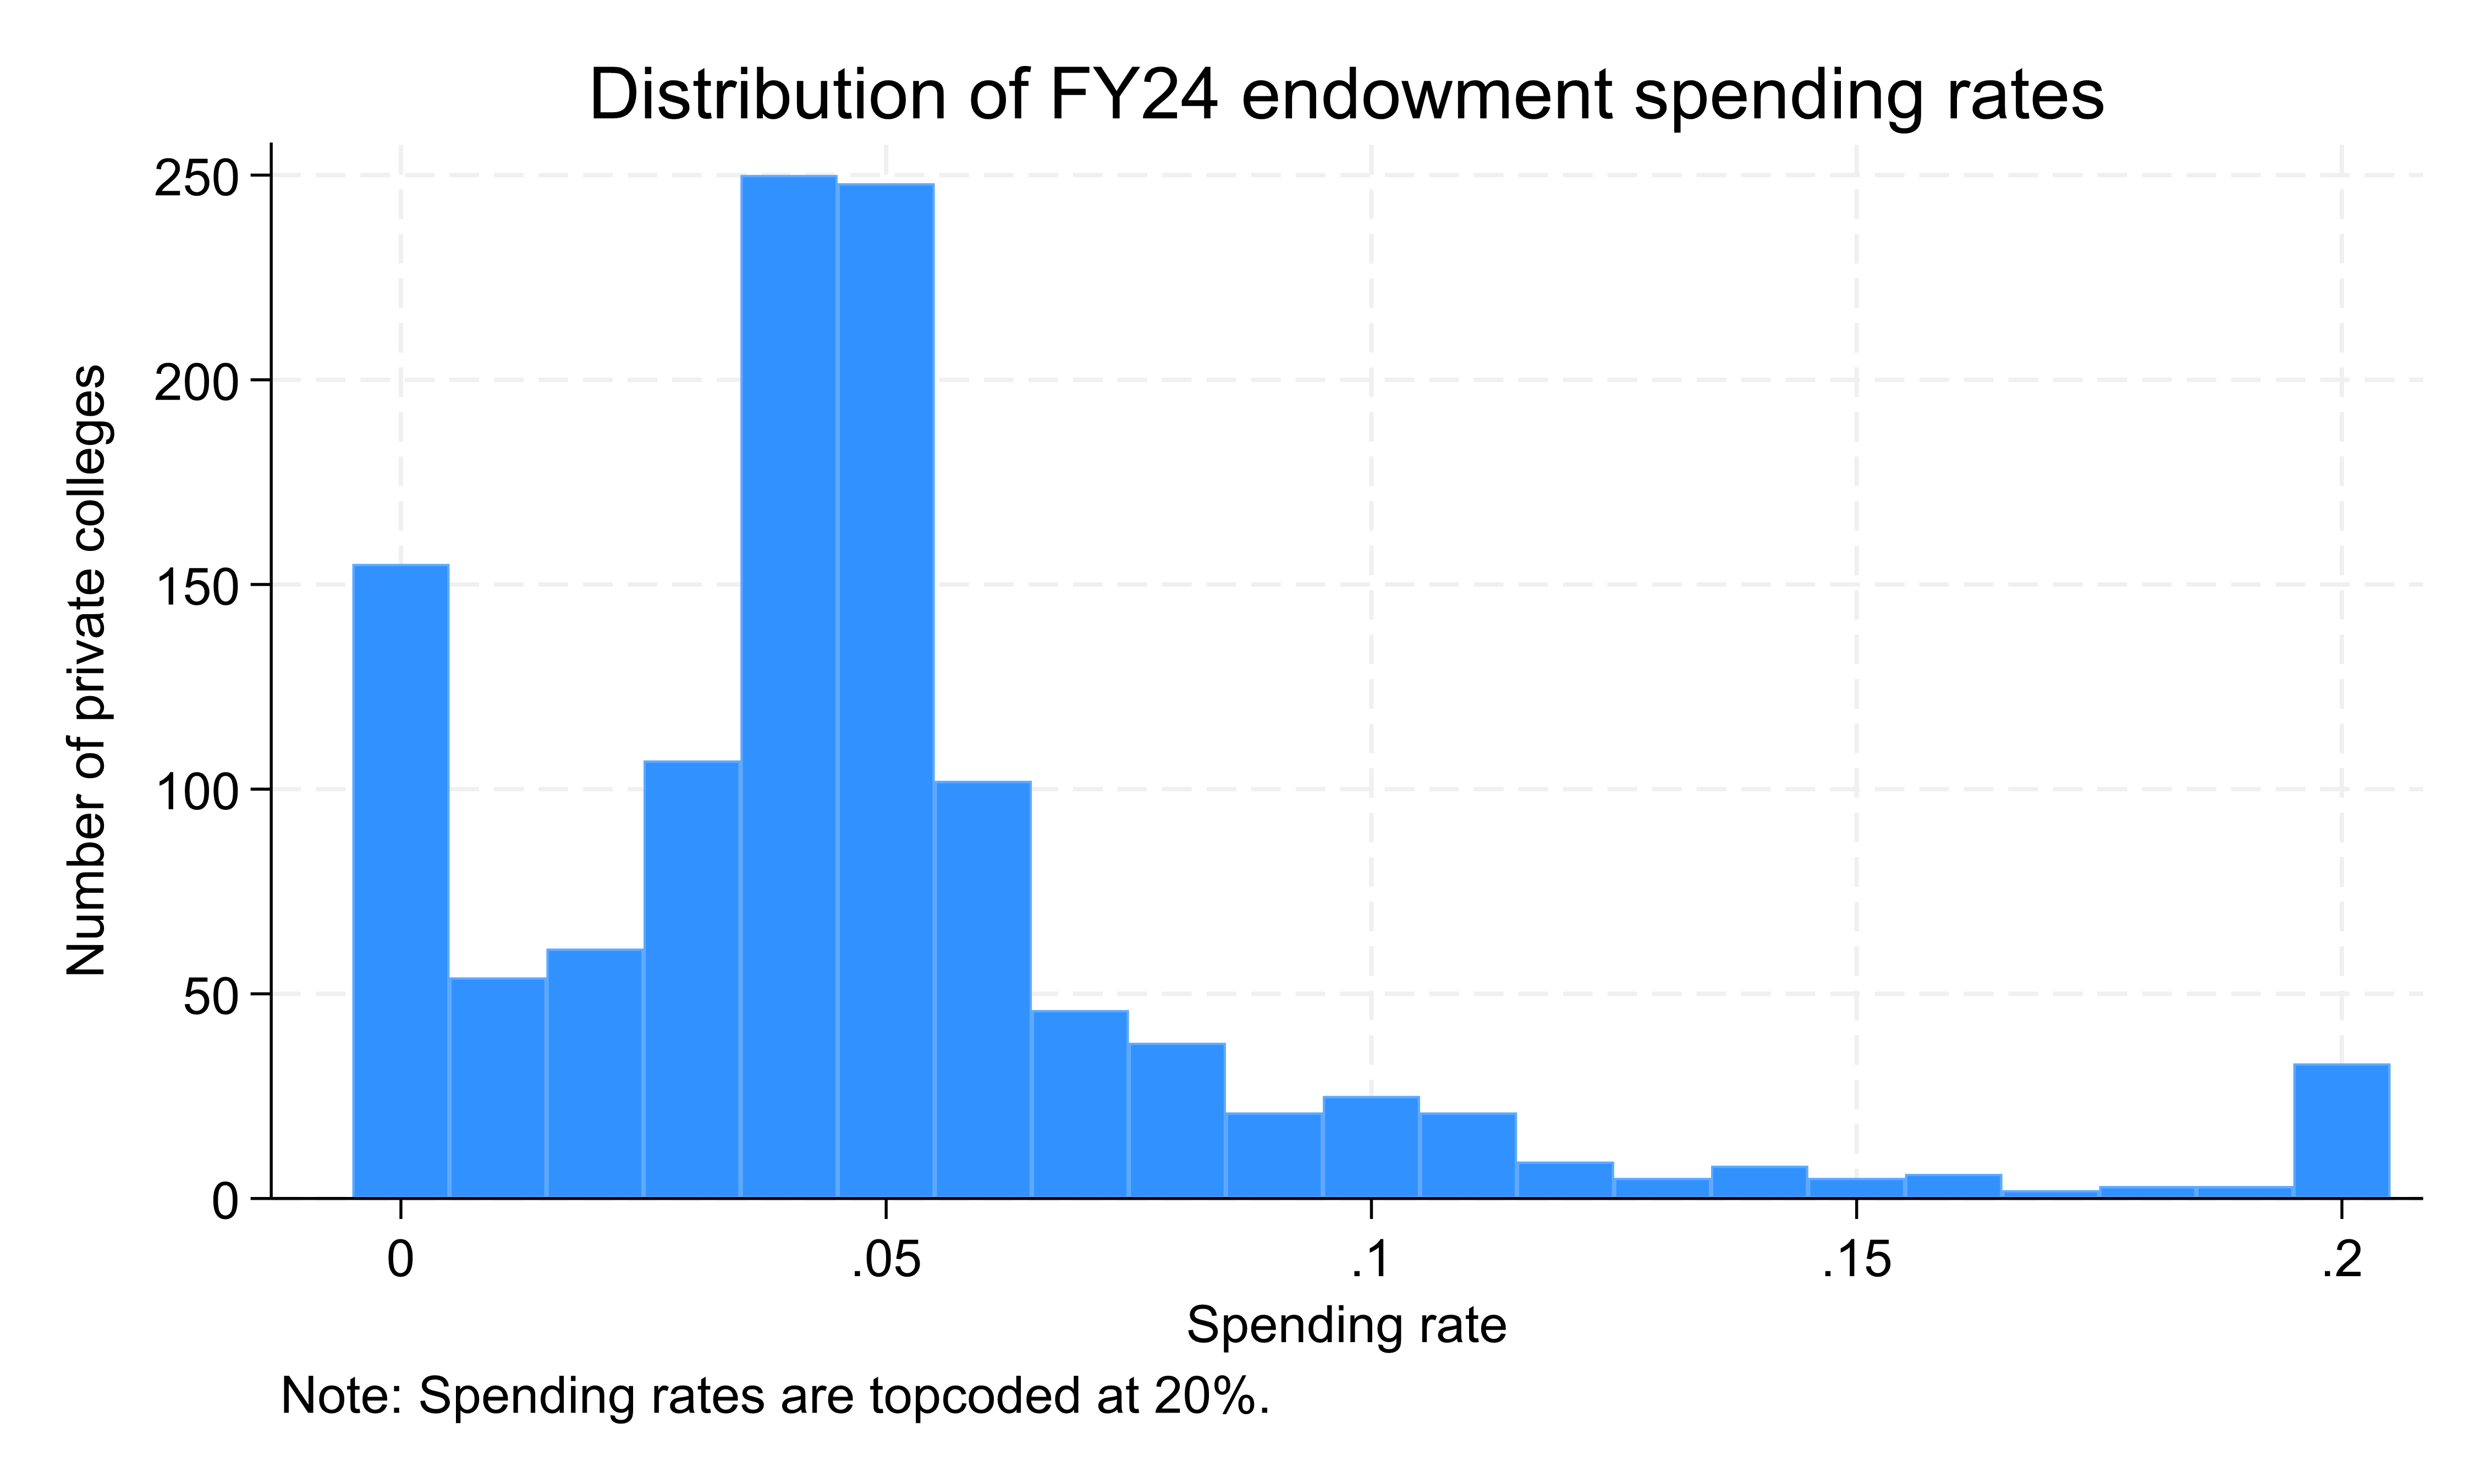
The first figure is the share of colleges by sector and year that lost money from Fiscal Year 2001 to 2024. The first thing that jumps out is the volatility of private nonprofit colleges, as stock market gyrations can result in relatively weak colleges posting gains and Ivy League institutions posting massive losses in certain years. But overall, the trend in the last few years has been positive for public colleges and mixed to negative for private colleges. In Fiscal Year 2024 (a strong year for the stock market and for appropriations in many states), 17% public institutions posted losses compared to 31% of private nonprofit and 37% of for-profit institutions. Public institutions posted higher rates of losses—close to 40%–in the late 2010s, while the worst year in recent memory for private nonprofits was 2022 at 64%.
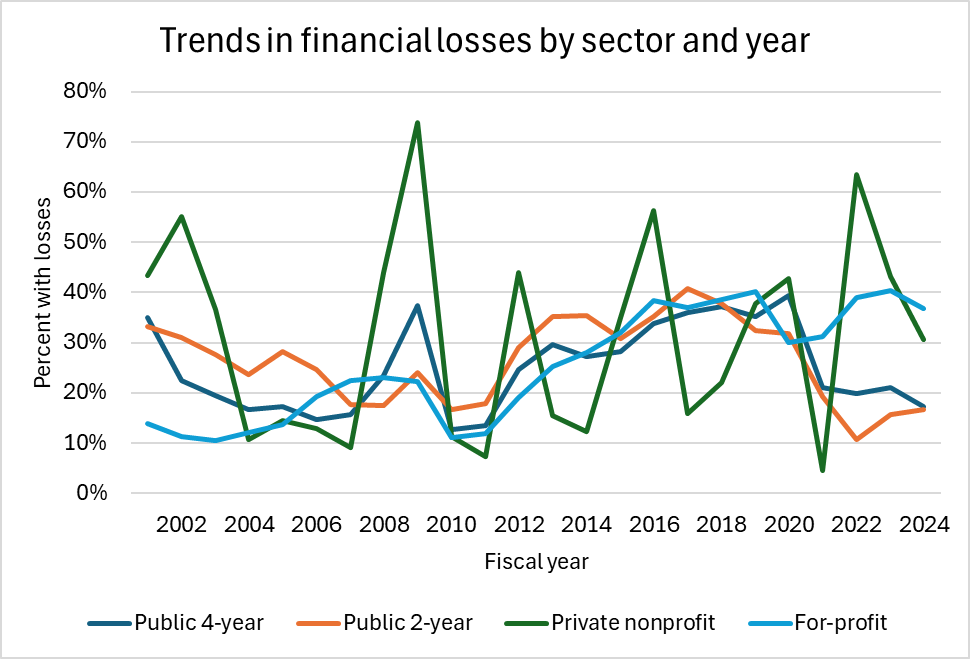
The second figure is the frequency of financial losses over the last ten years. Conditional on reporting data throughout the decade, the median institution across all sectors lost money in approximately 2-3 years. Nearly 20% of public institutions and 25% of for-profit colleges never lost money, compared to just eight percent of for-profits. On the other hand, ten percent of for-profit colleges and five percent of private nonprofits lost money in at least eight years compared to just 1-2 percent of public institutions.
I compiled a spreadsheet (available for download) of degree-granting institutions’ financial data over the last decade, sorted by the number of years that the institution lost money. For each year, there is a column for revenues and expenses (in millions) and whether the institution lost money. Judging by the reactions that I have received over the last couple of years, this has been a useful service to the field.
The obvious question is what the trend looks like for institutional finances going forward. Fiscal Year 2025 likely looked pretty good due to continued solid state funding, solid endowment returns, and most of the Trump administration’s research cuts only affecting the end of the fiscal year. But I expect the share of institutions that lose money to increase substantially in the current fiscal year due to federal, state, and economic pressures.
I thought that the end of 2025 was going to be relatively quiet when I wrote my last piece a couple of weeks ago, but my words to the Chronicle of Higher Education for their 25-year retrospective came back to bite me:
“It’s hard not to focus just on what has happened in 2025, because it seems like this year alone has been 25 years long.”
So I’m back with one more piece on New Year’s Eve before I throw a standing rib roast in the smoker to celebrate the coming of 2026. On December 30, the Department of Education released several new datasets on program-level outcomes in advance of early January’s negotiated rulemaking session on implementing accountability provisions set in place by last July’s budget reconciliation law (OBBB) that effectively served as a reauthorization of the Higher Education Act.
The key focus of the rulemaking session will be to determine whether there should be one or two accountability systems. Currently, gainful employment regulations focus on for-profit institutions and certificate programs at other institutions and base calculations on a debt-to-earning metrics. The new system approved by Congress in OBBB, however, excludes undergraduate certificates and bases passing on whether earnings are higher than a complicated threshold metric four years after completion. By also limiting loans to graduate students, the debt-to-earnings threshold is arguably less important now than in the past, making a good argument for a single metric for graduate students. But for undergraduates, debt is still a somewhat useful metric, although I do not know whether two systems would be worth the hassle.
This is a substantial dataset that goes well beyond the minimum needed to implement accountability, and I applaud the skeleton staff at the Department of Education for getting this done. I have pointed out issues with the firsttwo IPEDS data releases of the second Trump administration, but this one seems to have gone quite well. This also means that ED and the Internal Revenue Service have figured out interagency cooperation to update earnings data, meaning that a big College Scorecard update is also likely to come. I am still quite worried about ED’s ability to manage the huge proposed admissions data collection, so stay tuned on the data front.
The most important new program-level data elements are the following:
Noncompletion rate: This is defined as a student who received federal financial aid in a given year and then does not show up as a graduate or enrolled as a federal aid recipient in the next two years. This is a pretty generous definition in terms of allowing students to transfer programs or institutions, but it can also miss students who no longer receive federal aid. I’m watching the metric closely, but am not sure about using it yet.
Earnings: We finally get a new cohort of earnings data! For years, the program-level Scorecard has focused on students who graduated in 2014-15 or 2015-16, and that now gets refreshed to 2017-18 and 2018-19 graduates. This makes it possible to track changes in earnings across multiple cohorts, which is neat.
The number of financial aid recipients and grant/loan disbursements by program: This is brand-new data, and it is available for ten years (Fiscal Years 2016 through 2025).
OBBB earnings metric status: This compares the four-year earnings metric to the threshold, which is essentially what the student is estimated to have earned if they did not pursue that credential. Failing that metric in two of three consecutive years will subject the program to the loss of federal loan eligibility.
I am focusing on two key questions in the rest of this blog post, and I put together a dataset for download that contains the 91,989 programs with at least some data (just under half of all programs, as defined at the 4-digit CIP level).
Question 1: Which programs would fail the earnings threshold metric?
Overall, 2,964 of the 49,860 programs (5.9%) with sufficient data on program-level earnings are estimated to be below the earnings threshold. But there is a lot of variation by institution type, credential level, and field of study.
Pass
Fail
Failure rate
For-profit
2,345
1,268
35.1%
Nonprofit
14,446
492
3.3%
Public
30,105
1,204
3.8%
This is a bit of an eye-popping number—programs at for-profit colleges are about ten times more likely to fail than other sectors. But let’s dig deeper. Credential level matters a lot, with quite a few undergraduate certificates (which are not a part of the OBBB) failing. The failure rates by sector and credential level are not quite as jarring for the for-profit sector.
Public
Private nonprofit
For-profit
Undergrad certificate
13.3%
28.5%
55.8%
Associate
5.9%
8.2%
12.0%
Bachelor
1.0%
1.4%
3.8%
Post-bacc certificate
N/A
N/A
N/A
Master’s
3.1%
6.2%
12.0%
Graduate certificate
3.8%
3.9%
5.3%
First professional
0.0%
3.0%
31.3%
Doctoral
0.2%
2.2%
0.0%
I then looked by some of the most common fields of study (by 2-digit CIP code). Here is how the fields with at least 1,000 programs fared:
Field
Failure rate
Biology
1.1%
Business
1.8%
Communications
2.5%
Computer science
1.2%
Education
2.9%
Engineering
0.0%
Health
8.3%
Liberal arts
4.2%
Personal/culinary services
78.5%
Psychology
2.3%
Public administration
1.9%
Security
1.2%
Social sciences
1.3%
Visual/performing arts
17.7%
In general, most fields do pretty well (and engineering had exactly zero programs fail). But personal/culinary services, which is a field with a lot of undergraduate certificates (and tips for earnings that are not reported to the IRS), and visual and performing arts perform much worse.
Question 2: Which programs are facing challenges with reduced graduate student loan limits?
Effective July 1, 2026 (with the exception of some programs that are granted a brief reprieve), only a short list of so-called “professional” programs can access $50,000 per year in federal student loans and $200,000 during the entire length of the program. All other “graduate” programs are limited to $20,500 per year and $100,000 for the entire program. Based on my coding of the relevant CIP codes and the available data, I see 1,120 programs with available data as likely being professional and 17,297 programs likely being graduate.
The bad news for higher education is that quite a few programs have average debt (among borrowers) that is above these annual limits. Thirty percent of professional programs and 26% of graduate programs are over their caps, and in some cases well over the caps. For example, 461 graduate programs have more than $50,000 per year in annual borrowing and 20 professional programs (mostly in dentistry) have more than $100,000 per year in annual borrowing.
There are also differences by field of study in the number of programs over their loan limits. Of the most popular graduate programs (at least 450 observations), nearly half of health and biology programs averaged over the $20,500 annual limit among borrowers. Education, as usual, had the lowest rate of overages. Among professional programs, half of all health-related and veterinary medicine programs were over $50,000 per year in average debt. One-fourth of law schools exceeded the new limit, while only nine of 211 psychology programs and zero theology programs were in excess of $50,000.
Field
Over the limit (pct)
Biology
46.8%
Business
18.8%
Computer science
21.7%
Education
8.7%
Health
46.9%
Multidisciplinary studies
30.7%
Psychology
22.1%
Public administration
21.8%
Visual/performing arts
37.8%
There is a lot more in this dataset, and there is always the possibility of additional data releases next week as negotiators ask for additional information. But for now, Happy New Year!
The newest round of data on American colleges and universities from the Department of Education’s Integrated Postsecondary Education Data System (IPEDS) was released last week. While the data—on admissions, financial aid, student charges, and graduation rates—were only a few days later than in past years in spite of the longest government shutdown on record this fall and greatly diminished capacity at ED, the two data releases in recent months have had some uncharacteristic issues. The release earlier this fall was marred with coding issues, and the most recent release had data files not initially posted and issues that make the new cost of attendance survey unusable in my view for vocational institutions.
The Trump administration is keenly interested in the admissions survey, and has proposed a massive expansion that would retroactively collect large amounts of data by race/gender and test scores going back to 2019-20—and that the data collection would happen in the spring of 2026. (James Murphy has covered the government regulation burden angle incredibly well. Check out his work.) This goes well beyond a previously scheduled set of changes for fall 2025 data collection that will collect admissions data by race and gender, which would not be done retroactively.
I took a quick look at fall 2024 admissions data to get a sense of a key policy debate—admissions rates by gender—and to show some of the concerns with drawing policy conclusions from institution-level IPEDS data. A full spreadsheet can be downloaded here.
In aggregate, there is little evidence that men or women are admitted to selective colleges at different rates. For the 298 institutions with acceptance rates below 50%, women were admitted to the median institution at a rate 1.3 percentage points higher than men. This fell to 0.08 percentage points for the 100 institutions accepting fewer than 25% of students and men were favored by 0.04 percentage points for the 31 institutions accepting fewer than 10%.
But there are some interesting items at the institution level. Circle in the Square Theatre School (which I have never heard of, but it seems like a fascinating piece of geometry) admitted 5.01% of women and 1.26% of men. Caltech, MIT, and UCLA admitted higher shares of women, while Chicago, Brown, and Swarthmore admitted higher shares of men. Meanwhile, my university admitted men and women at nearly identical 46% rates…but women were 60% of applicants. Take a spin through to see what you think.
Just cutting the data by gender brings down sample sizes quite a bit, so race/gender admissions rates are going to be noisy at many institutions. For example, the Julliard School accepted men at a higher rate than women (10.6% compared to 7.9%), but only received a total of 2,020 applications. If a racial group represents only a small percentage of applicants (White students are the largest share of current students at just 29%), then a few applications could move percentages quite a bit. Adding test scores or high school GPA to the mix (like the Trump administration proposes) will make data far too volatile for high-stakes accountability, but that appears to be the future as federal investigations are likely to be linked to changes in a small number of student applications or admissions.
On a final note, I wish you a wonderful end to 2025. Check out my interview with the fabulous Alex Usher of Higher Education Strategy Associates for my top ten events in American higher education this year. And for those working on college campuses, take the time to learn how both faculty and staff schedules work once classes end. Many faculty are off contract, while staff may be trying to take time off before vacation days expire.
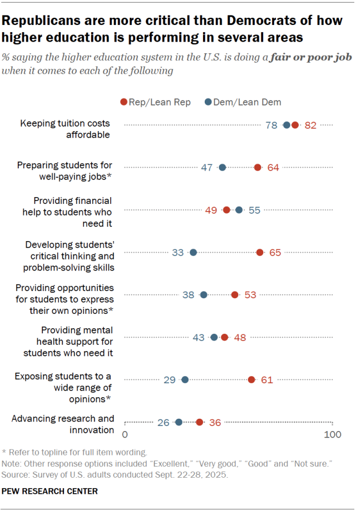
Higher education is facing a crisis of confidence among the general public, and much of that is driven by concerns regarding affordability. For example, about 80 percent of Democrats and Republicans alike think that colleges do not sufficiently prioritize affordability.
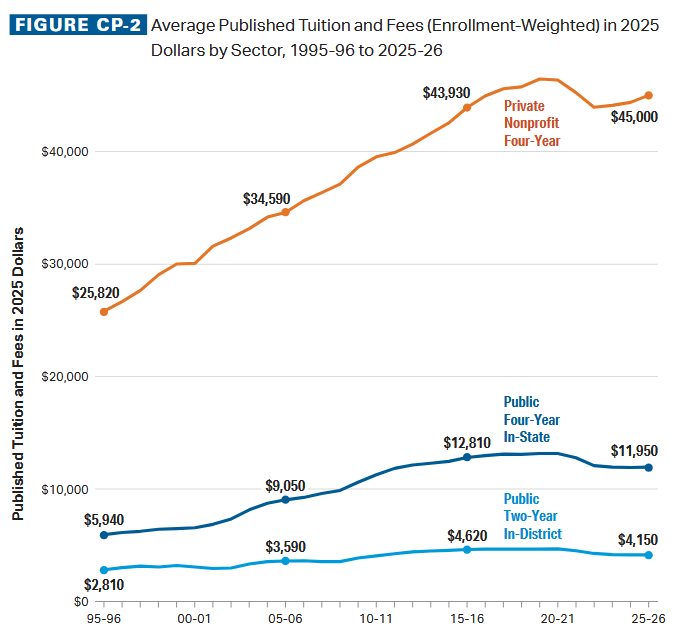
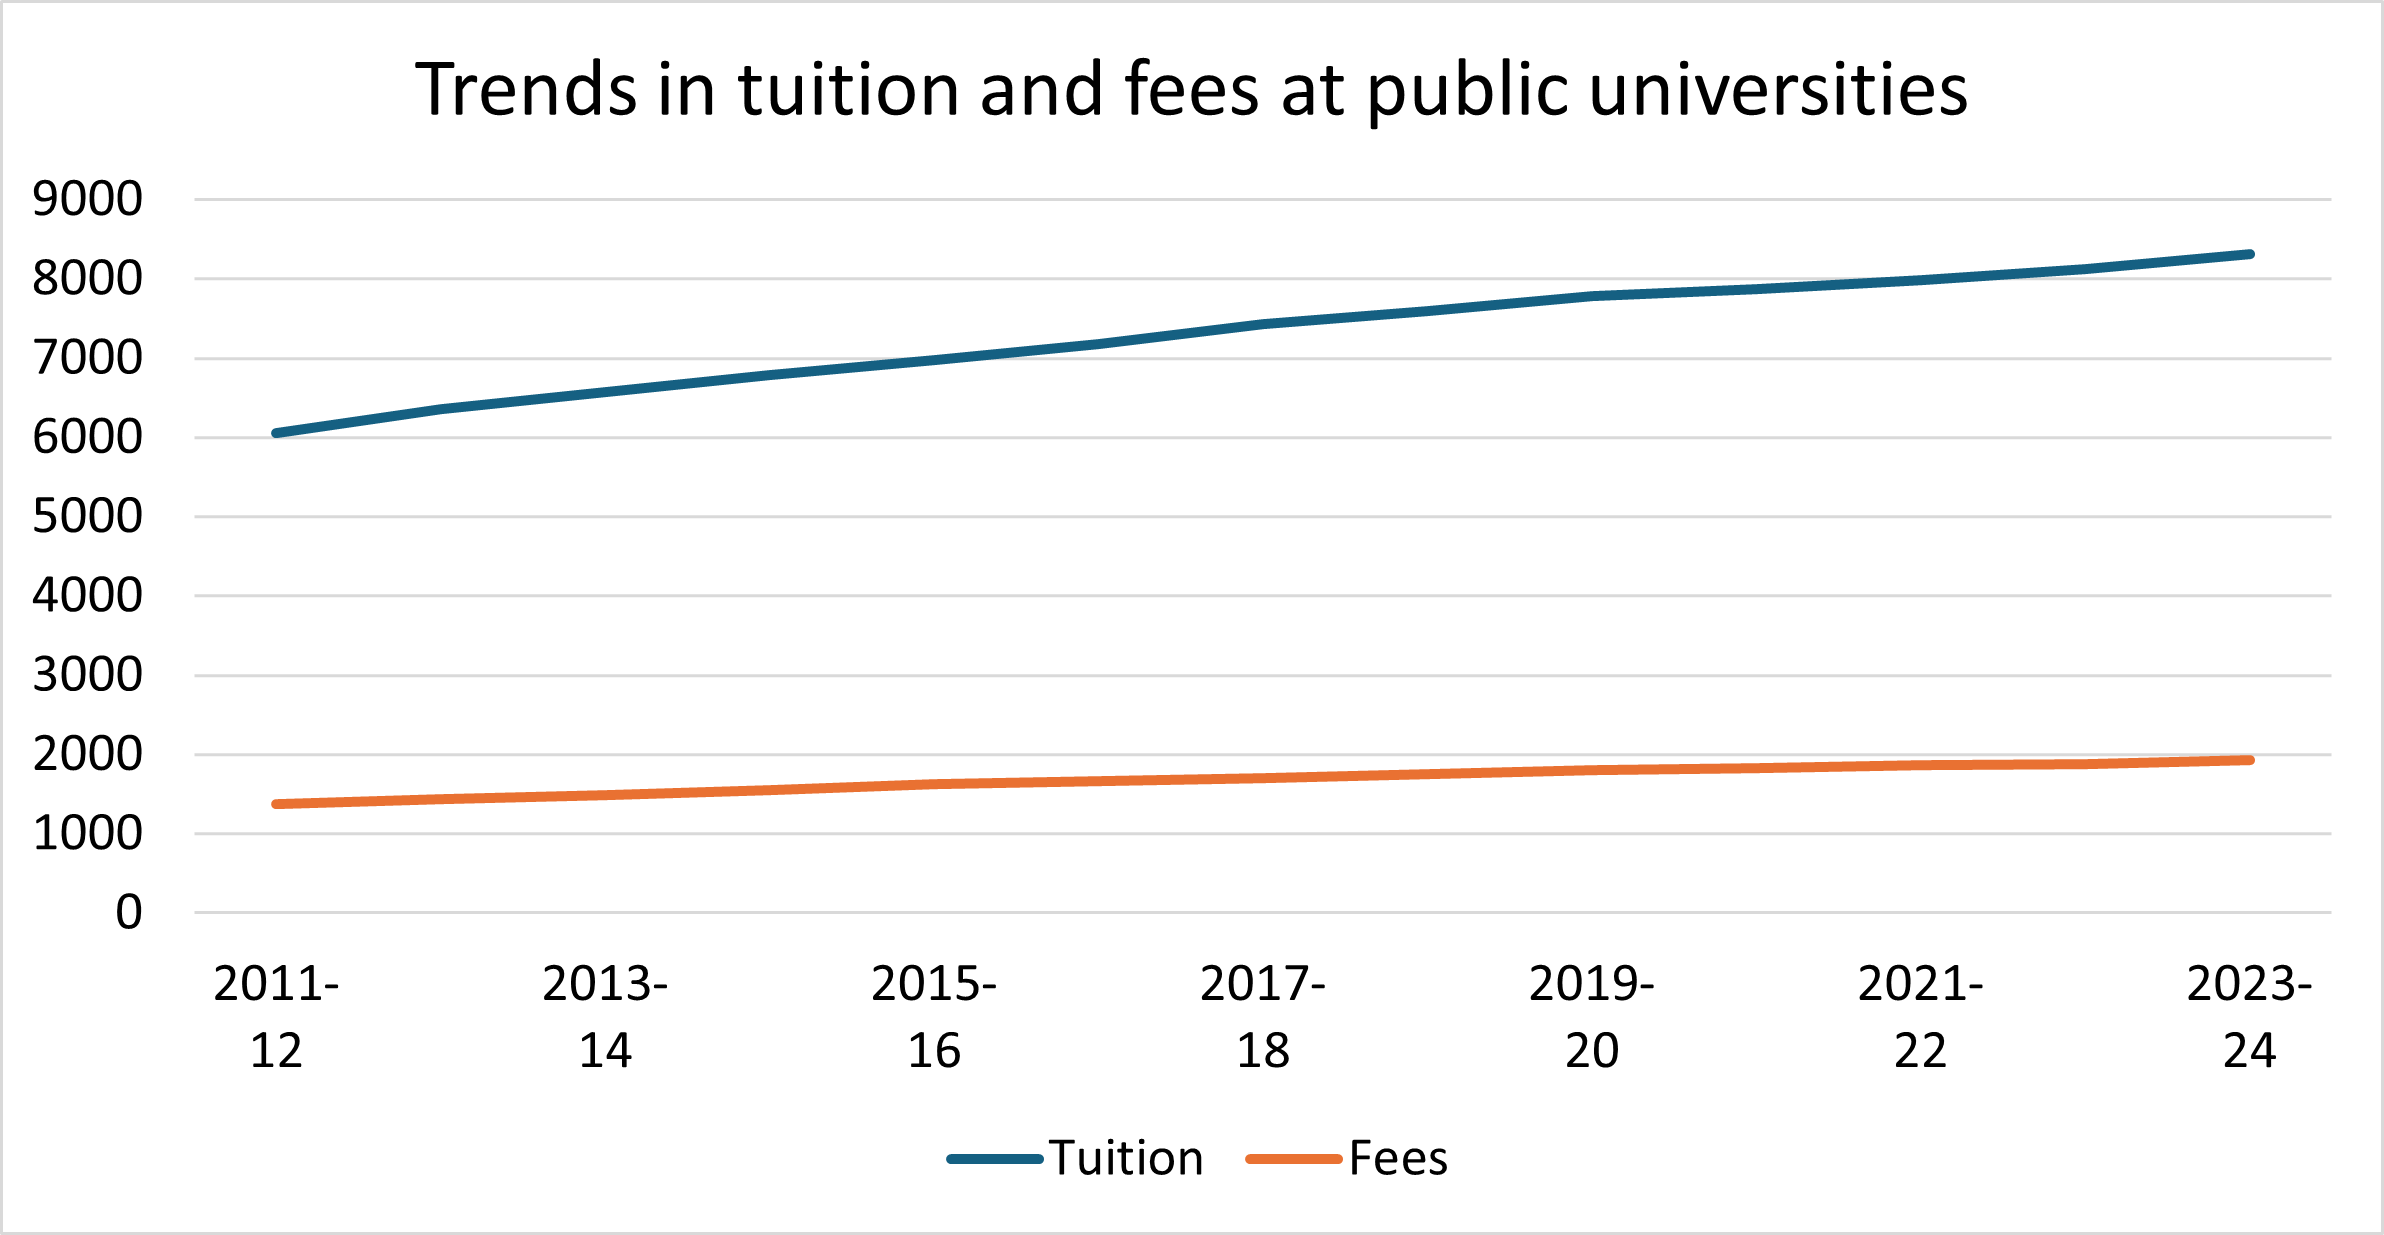
But while college is still expensive, the narrative that colleges and universities are increasing their tuition willy-nilly has not been true for a decade. See this chart from the College Board’s helpful Trends in College Pricing report, which has data through the 2025-26 academic year—two years ahead of U.S. Department of Education data. Tuition increases have been at or below inflation for the last decade, breaking a decadeslong trend of increases well above the rate of inflation.
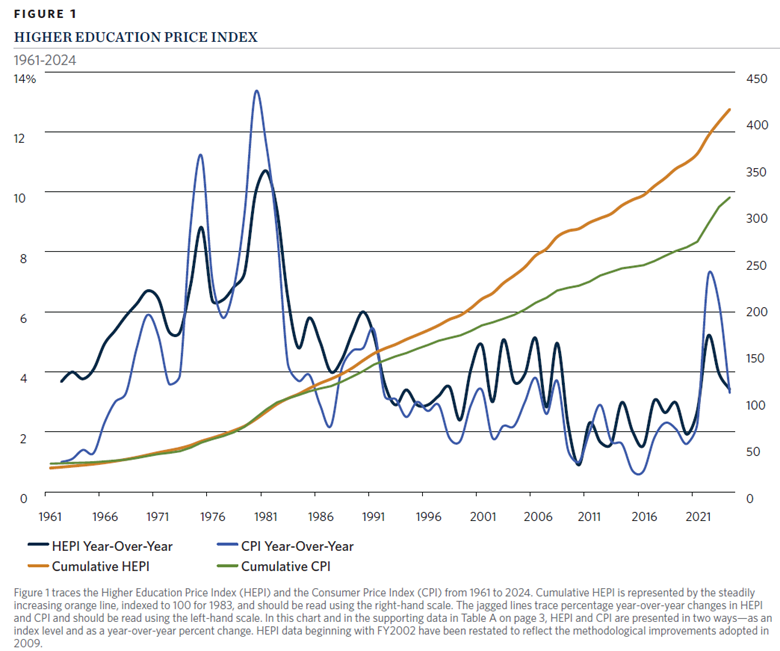
This is why I was disappointed to see a recent NPR piece that focused on how college costs (which should be prices—grrrr) have doubled in inflation-adjusted dollars in the last three decades. (The headline of doubling over 20 years is inaccurate, but it is right in the main part of the piece at 30 years.) Yes, listed tuition and fees doubled between 1995 and 2015, but they have not budged in the last decade. And if grant aid is taken into account, much of higher education is close to pre-Great Recession affordability. That is in spite of operating costs (as proxied by the Higher Education Price Index) rising faster than inflation over much of the period, driven by benefits and maintenance costs.
This more nuanced narrative (affordability is still a concern, but the situation has actually improved in public higher education) is important to communicate to the general public. The NPR piece was spot-on in 2015, but less so in 2025.
With all that being said, colleges are under more pressure to generate revenue than at any point in recent years. State funding has been an unsung hero for the last decade, and that is likely to take a hit as budgets get tight. With all of the pressures coming out of Washington, institutions are likely to turn to larger tuition increases if at all possible. Public institutions are frequently constrained by state-level tuition controls, which are present in about 30 states. But other public and private institutions may try to get more revenue out of tuition, breaking a promising trend that few people outside of higher education even knew was in progress.
Negotiated rulemaking, in which the federal government convenes representatives of affected parties before implementing major policy changes, is one of the wonkier topics in higher education. (I cannot recommend enough Rebecca Natow’s book on the topic.) Negotiated rulemaking has been in the news quite a bit lately as the Department of Education works to implement changes to federal student loan borrowing limits passed in this summer’s budget reconciliation law.
Since 2006, students attending graduate and professional programs have been able to borrow up to the cost of attendance. But the reconciliation law limited graduate programs to $100,000 and professional programs to $200,000, setting off negotiations on which programs counted as “professional” (and thus received higher loan limits). The Department of Education started with ten programs and the list eventually went to eleven with the addition of clinical psychology.
In this short post, I take a look at the debt and earnings of these programs that meet ED’s definition of “professional,” along with a few other programs that could be considered professional but were not.
Data and Methods
I used program-level College Scorecard data, focusing on debt data from 2019 and five-year earnings data from 2020. (These are the most recent data points available, as the Scorecard has not been meaningfully updated during the second Trump administration. Five-year earnings get students in health fields beyond medical residencies. I pulled all doctoral/first professional fields from the data by four-digit Classification of Instructional Programs codes, as well as master’s degrees in theology to meet the listed criteria.
Nine of the eleven programs had enough graduates with debt and earnings to report data; osteopathic medicine and podiatry did not. There were five other fields of study with at least 14 programs reporting data: education, educational administration, rehabilitation, nursing, and business administration. All of these clearly prepare people for employment in a profession, but are not currently recognized as “professional.”
Key takeaways
Below is a summary table of debt and earnings for professional programs, including the number of programs above the $100,000 (graduate) and $200,000 (professional) thresholds. Dentistry, pharmacy, and medicine have a sizable share of programs above the $100,000 threshold, while law (the largest field) has only four of 195 programs over $200,000. Theology is the only one of the nine “professional” programs with sufficient data that has higher five-year earnings than debt, suggesting that students in other programs may have a hard time accessing the private market to fill the gap between $200,000 and the full cost of attendance.
On the other hand, four of the five programs not included as “professional” have higher earnings than debt, with nursing and educational administration being the only programs with sufficient data that had debt levels below 60% of earnings. More than one-third of rehabilitation programs had debt over the new $100,000 cap, while few programs in other fields had that high of a debt level. (Education looks pretty good now, doesn’t it?)
I expect the debate over what counts as “professional” to end up in courts and to possibly make its way into a future budget reconciliation bill (about the only way Congress passes legislation at this point). Until then, I will be hoping for newer and more granular data about affected programs.
Even though there have been longstanding ideological differences across states, higher education leadership was largely insulated against these differences over the last half-century. Yes, they popped up in meaningful ways on topics such as South African divestment, affirmative action, and antiwar protests, but it was possible for university leaders to move from red states to blue states and vice versa. It helped to share the state’s political leanings, but it was generally not a requirement.
The last month has clearly shown that potential presidents now must pass an ideological litmus test in order to gain the favor of governing boards and state policymakers. Here are three examples:
Santa Ono’s hiring at Florida was rejected by the system board (after being approved by the campus board) due to his previous positions in favor of diversity initiatives and vaccine mandates. He tried to pivot his views, but it was not enough for Republican appointments on the board.
Six red states, led by Florida and North Carolina, are seeking to launch a new accreditor to break free from their longtime accreditor (which was the only major institutional accreditor to never have a DEI requirement, although their diversity page is now blank). Florida Governor Ron DeSantis used his press conference to go on a tirade against higher education, but the North Carolina system’s statement was more cautious, focused on academic quality.
The Trump administration’s Justice Department effectively forced out University of Virginia president James Ryan over his alleged noncompliance in removing diversity initiatives from campus. This effort was successful because Virginia’s Republican governor also supported removal and has the ability to push the institution’s governing board to take action.
While there has been a long history of politicians across the ideological spectrum leading universities (such as Mitch Daniels at Purdue, John King at the State University of New York, and Dannel Molloy at Maine), these politicians have generally set aside most of their ideological priors that are not directly related to running an institution of higher education. But now a growing number of states are expecting their campus presidents to be politicians that are perfectly aligned with their values.
There are two clear takeaways from recent events. The first is that college presidents are now political appointments in the same way that a commissioner of education or a state treasurer would be in many states. Many boards will be instructed (or decide by themselves) to only hire people who are ideologically aligned to lead colleges—and to clean house whenever a new governor comes into power. The median tenure of a college president is rapidly declining, and expect that to continue as more leaders get forced out. Notably, by threatening to withhold funding, governors do not even have to wait for the composition of the board to change before forcing a change in leadership. New presidents will respond by requesting higher salaries to account for that risk.
Second, do not expect many prominent college presidents to switch from red states to blue states or vice versa. (It may still happen among community colleges, but even that will be more difficult). The expectations of the positions are rapidly diverging, and potential leaders are going to have to choose where they want to be. Given the politics of higher education employees, blue-state jobs may be seen as more desirable. But these positions often face more financial constraints due to declining enrollments and tight state budgets, in addition to whatever else comes from Washington. Red-state jobs may come with more resources, but they also are likely to come with more strings attached.
It is also worth noting that even vice president and dean positions are likely to face these same two challenges due to presidential transitions and the desire of some states to clean house within higher education. That makes the future of the administrative pipeline even more challenging.
Quite a bit of my research and public writing in the last few years has been on the topic of college closures and institutions in financial distress. I’m also a bit on the nerdy side, as evidenced by the fact that I am still trying to figure out who sent us a Stata onesie when our first child arrived several years ago. So it’s not a surprise that I jumped on the opportunity to be able to visit the former Iowa Wesleyan University while taking a family trip this summer.
A bit of the backstory on Iowa Wesleyan: it was founded in 1842 in Mount Pleasant, Iowa as the first co-educational private institution west of the Mississippi River. After Parsons College in nearby Fairfield suddenly collapsed and closed in 1973, it was the only traditional four-year institution within a 50-mile radius. And the two closest larger institutions (the University of Iowa and Truman State University in Missouri—my alma mater) are relatively selective, leaving Iowa Wesleyan with a market niche.
But as the tri-state area of southeast Iowa, northeast Missouri, and western Illinois saw a decline in the number of high school graduates, the university struggled. The university received $26 million in a US Department of Agriculture loan to help avoid a closure in 2018 (helped by the Secretary of Agriculture’s wife being on the board. But even as enrollment increased (thanks to athletics), tuition revenue did not. A last-ditch appeal to Iowa’s governor for $12 million failed, and the college closed in 2023; the campus then went to the USDA as its main creditor.
Figuring out what to do with a closed college campus is always a challenge, as these campuses are built for a particular purpose and deferred maintenance is often an issue. Campuses in rural areas face particular concerns, as it is much harder to attract a buyer when there is a smaller population base nearby. Mount Pleasant was fortunate to find several buyers for parts of the campus when the USDA put it up for sale. The primary owner of the campus is the local school district, which bought athletic facilities and an auditorium. The district is also considering putting an elementary school on the site to use existing facilities as much as possible.
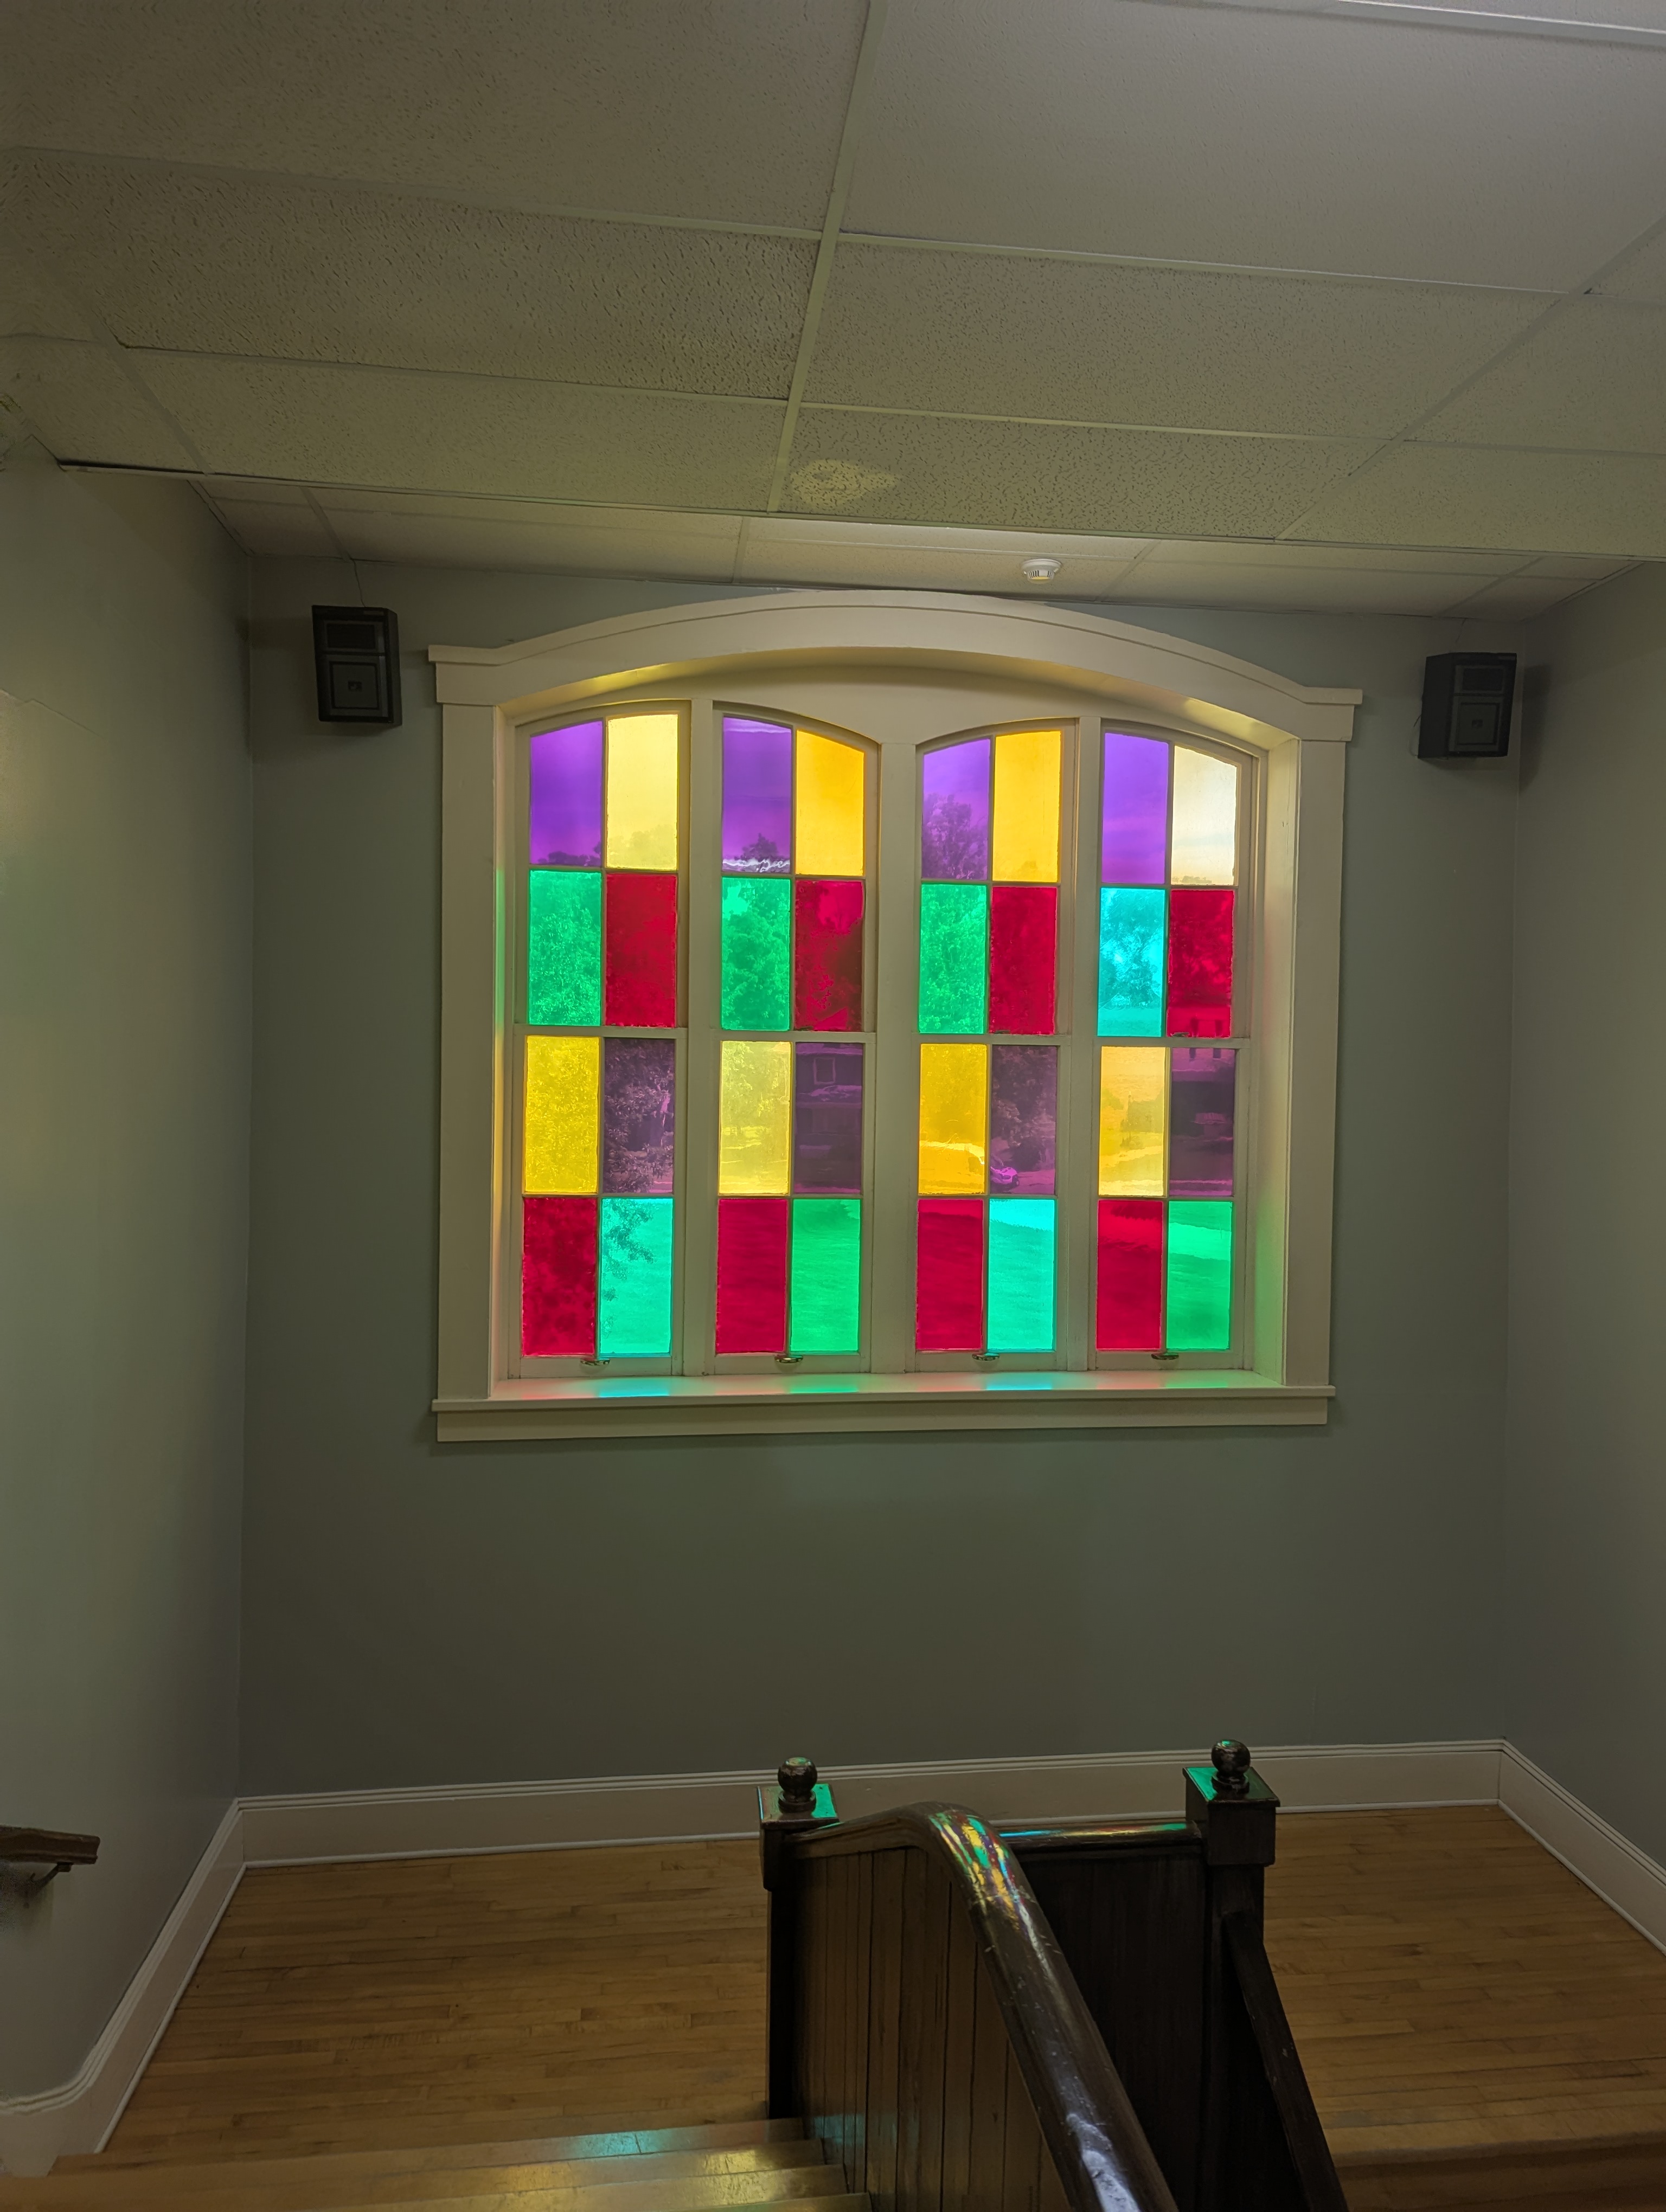
Here are some pictures of the campus, and a big thank you to P.E.O. International (my wife is a member of this group that supports women’s education) for the opportunity to tour the campus’s oldest building. The campus grounds are neat and tidy, but there are certainly signs of deferred maintenance issues throughout.
The Iowa Wesleyan signs have been replaced with signs for the local school district.
The main quad of campus. It still looks like a great place to hang out.
The original building on IWU’s campus. It is stately, but also has maintenance issues.
Stained glass windows just don’t exist like this any more.
Providing a sense of the facilities challenges of a campus that is well over 100 years old.
And as an aside, a Google search for Iowa Wesleyan shows the following website as the top result. Note the .com on the website and the random international phone number (from India) at the bottom right corner. It looks like a fraud.
The admissions page is actually active, but it seems even more dubious than the rest of the site. Someone duplicated the website for their own uses.
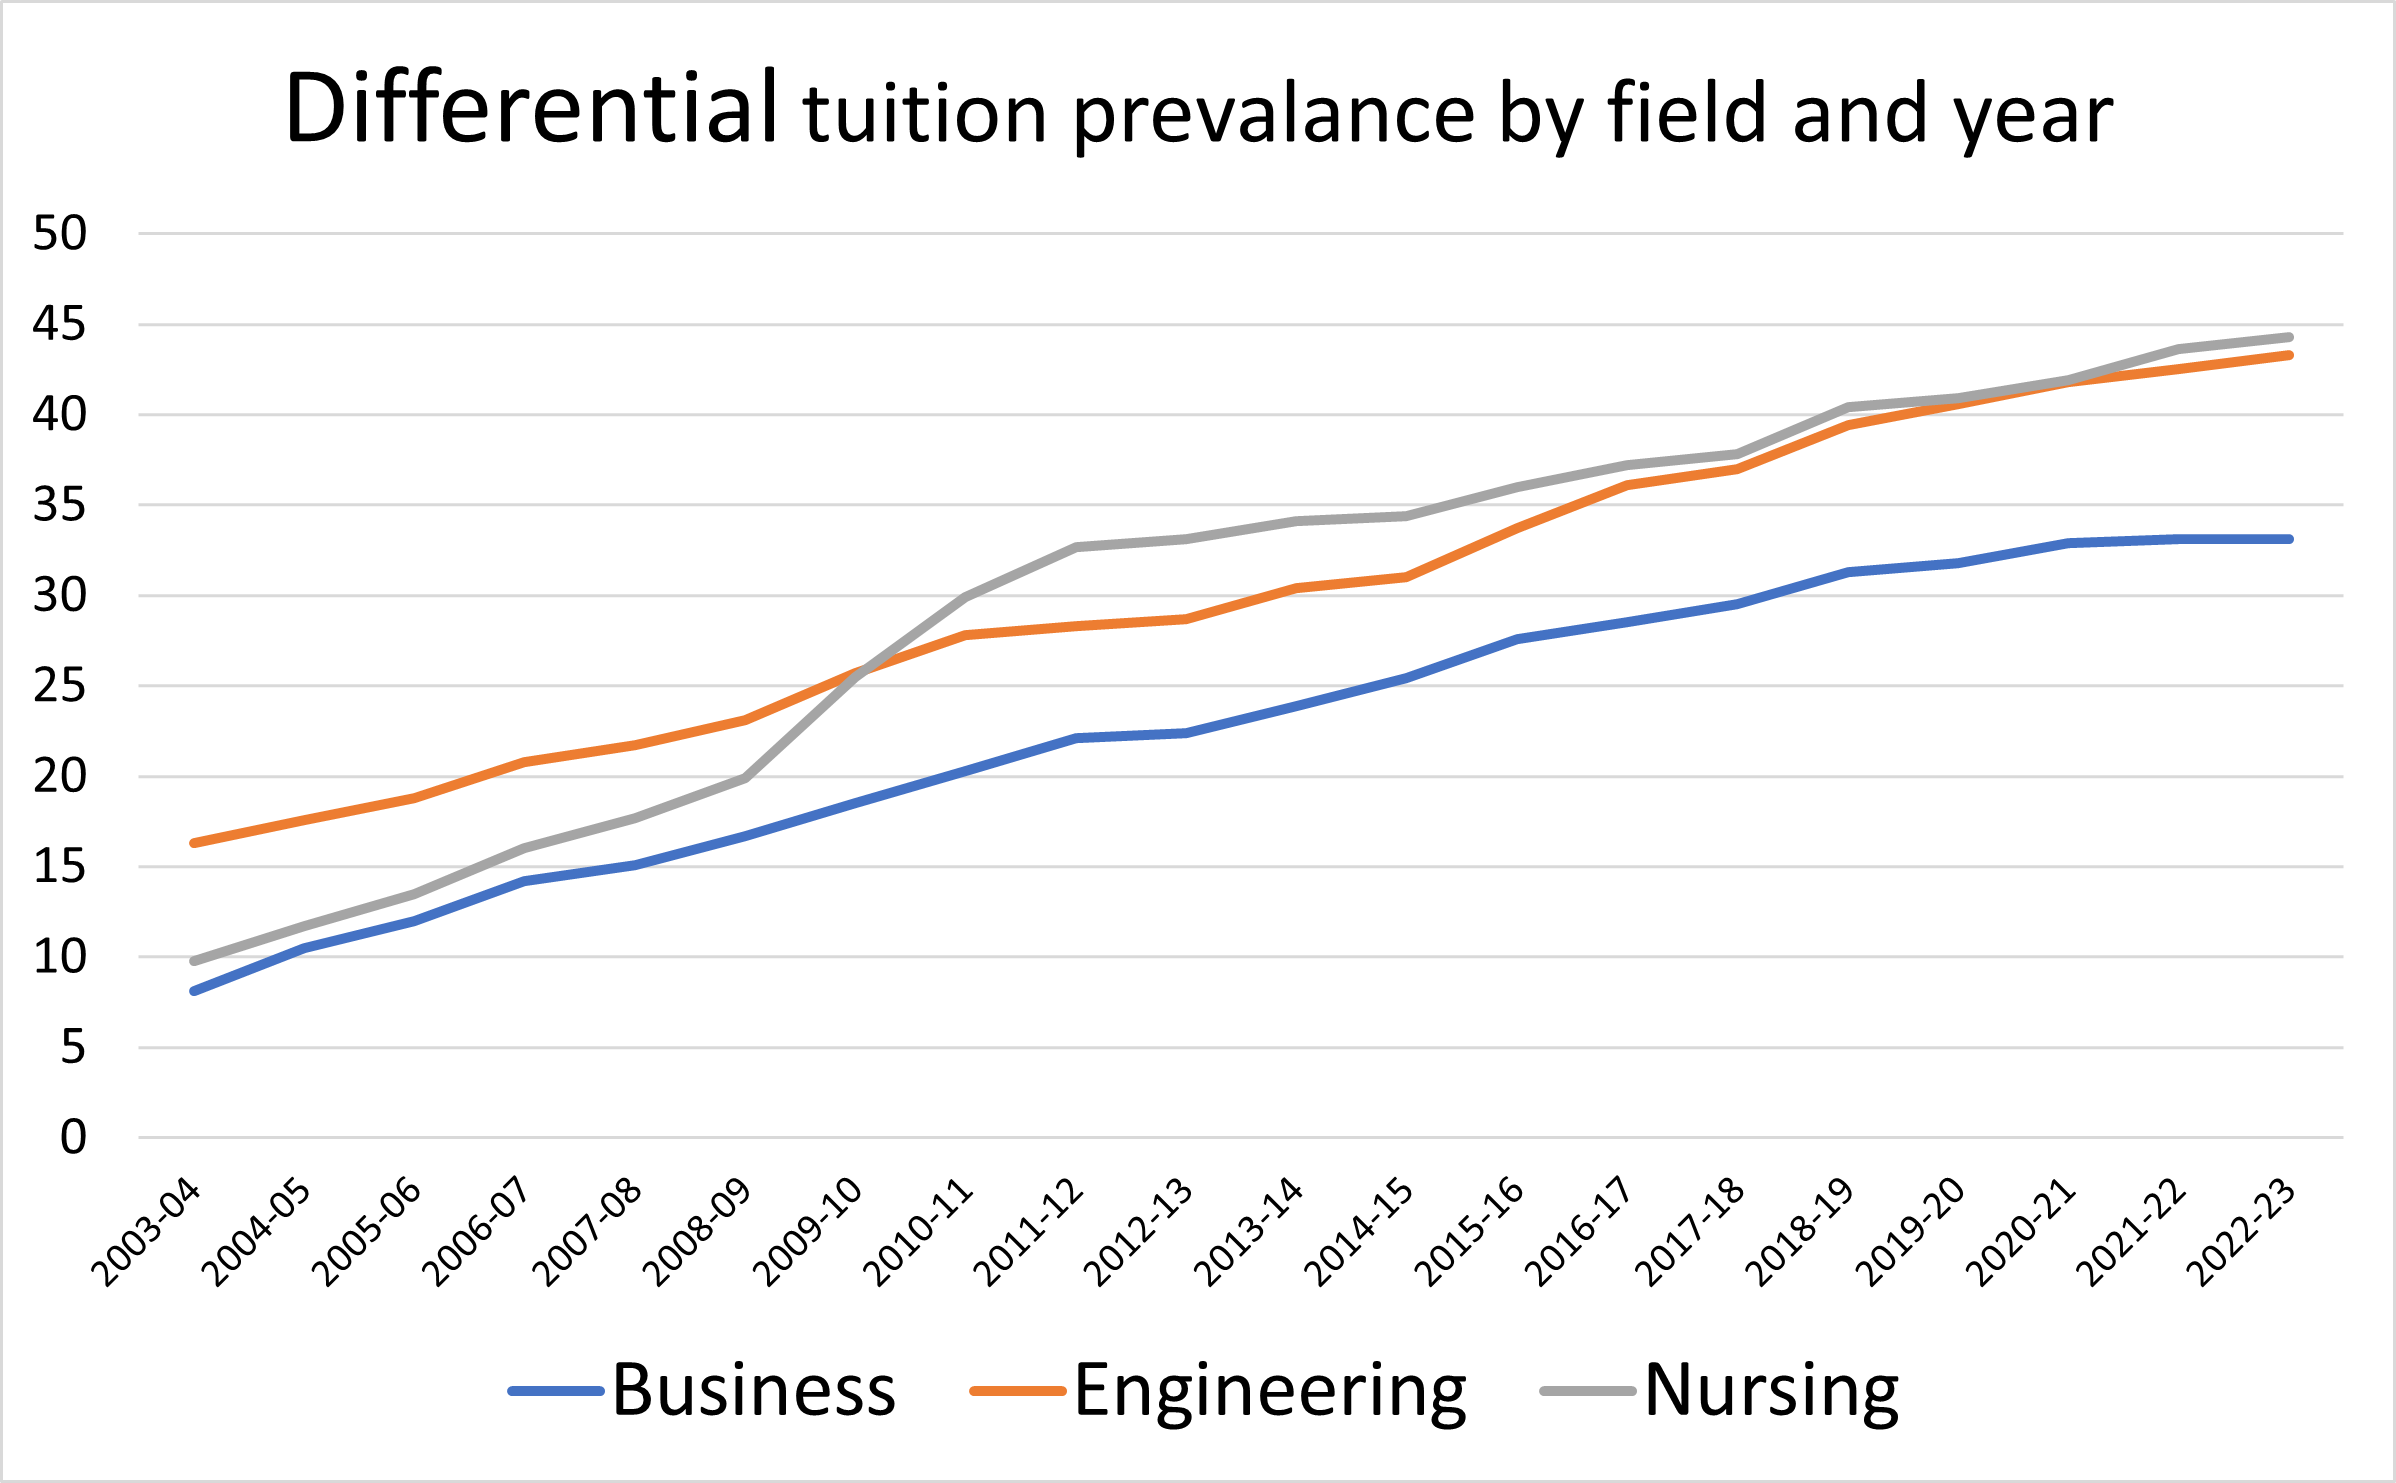
I am thrilled to share a new open-access article in AERA Open that I wrote on the topic of differential tuition policies at public universities. Differential tuition, in which students pay higher charges for fields of study that are more expensive to operate and/or are in high demand among students, have anecdotally become more popular in recent years. Yet the only published research on the effects of differential tuition (a great study that motivated my work) focused on public research universities that adopted differential tuition by the 2007-08 academic year.
I decided to slowly chip away at collecting data on the presence of differential tuition in business, engineering, and nursing programs between the 2003-04 and 2022-23 academic years. It took me more than three months to compile a dataset that you can download here, and then several additional months to do data checks and write the paper (with the help of a new research assistant who debuted during the project and alternated between sleeping and data entry).
Notably, nearly half of all public universities—and just over half of all research universities—adopted differential tuition by the 2022-23 academic year. While I did not have the resources to collect data on the amount of the differential (funders, reach out if you’re interested in supporting an extension of this work!), differentials ranged from a few dollars per credit hour to several thousand dollars per year.
I then examined whether the adoption of differential tuition increased the number of bachelor’s degrees awarded in business, engineering, or nursing. In general, there were no effects on business or nursing and some modest increases in the number of engineering degrees. However, any benefits of expanded access largely accrued to White students.
Check out the full article and let me know what you think. I am certainly open to extending this work, so any suggestions would be greatly appreciated.
Amid everything going on in the world of higher education right now, it is easy to forget that this is the time of year that students and families are trying to figure out whether they can afford to attend college. This is when I typically get a bunch of questions from journalists across the country about the extent to which college is affordable, and I do my best to provide helpful information.
I have written about student fees at public universities in the past, and the topic is the source of several questions in the last few weeks. In response to that, I updated my work to examine the most up-to-date data available on trends in student fees at public universities that include a look at what has happened since the pandemic. I did this using data on 499 public universities from the 2011-12 through the 2023-24 academic years, excluding about two dozen institutions (including all of Massachusetts) that “reset” fees by shifting most of their fees into tuition at some point during the period. The data for this analysis can be downloaded here.
Overall, tuition went up by 37% between fall 2011 and fall 2023, while fees went up by 40%. This is slightly higher than the 35% overall rate of inflation (as measured by the Consumer Price Index) over this same period. It also marks a change from the 2000s, in which fees went up substantially more than tuition. The growth in tuition and fees slowed considerably around the pandemic, which reflects an increase in the number of tuition freezes during the period and difficulties increasing fees while many students were studying remotely.
But in fall 2023, fees increased more quickly than tuition. The question is whether that becomes a trend—and whether that will be able to be studied using federal data. It would be possible to continue this analysis by collecting data from institutional websites or fact books, but it would also require a number of assumptions about how to handle the complicated structures of differential tuition by field of study and number of credits taken.