As the Senate works on its version of a Higher Education Act reauthorization bill, the Health, Education, Labor and Pensions Committee has made accountability one of its key areas of discussion in recent hearings. Committee chairman Lamar Alexander asked the higher education community for comments regarding accountability, so I sent my comments along to the committee. They are reprinted below.
February 15, 2018
The Honorable Lamar Alexander
The Honorable Patty Murray
Senate Health, Education, Labor and Pensions (HELP) Committee
Dear Senators:
My name is Robert Kelchen and I am an assistant professor of higher education at Seton Hall University.[i] I have been closely following the Higher Education Act reauthorization hearings in the Senate HELP Committee and am pleased to see the committee beginning to work on writing a comprehensive, bipartisan piece of legislation. Accountability is a crucial issue for both protecting students and taxpayers alike, and is such it is essential to design a system that encourages institutional improvement while discourages colleges from trying to game the system to remain eligible to receive federal Title IV financial aid dollars.
I have spent the last several years researching higher education accountability in all of its forms, including efforts by the federal government, state governments, accrediting agencies, the private sector, and colleges themselves.[ii] In this letter, I share four key points from my research on how to design accountability systems that have the highest likelihood of success and provide the best possible information for students, their families, and policymakers.
Point 1: Avoid all-or-nothing accountability systems. Three key federal accountability policies—cohort default rates (CDRs), the 90/10 rule, and gainful employment—grant institutions access to federal Title IV financial aid if they pass a certain threshold. Although the gainful employment metrics are too new to actually take away programs’ financial aid, it is clear from CDRs and the 90/10 rule that very few colleges are affected. In the most recent year of data, only ten small colleges faced the loss of either federal student loans or all Title IV aid for high CDRs and no colleges were subject to the loss of federal student aid for failing the 90/10 rule in two consecutive years.[iii]
Setting minimum performance floors sounds like an appealing idea, and the idea of ‘bright line’ standards has been proposed with respect to recognizing accreditors.[iv] But actually following through and pulling the plug on the lowest-performing colleges by denying them access to federal financial aid is a much more difficult task. As the majority staff’s white paper notes, just eleven colleges have lost access to Title IV funds due to high CDRs since 1999—even though approximately ten colleges per year should have lost aid if federal laws were strictly followed. Congress and the Department of Education have shown a lack of willingness to effectively close colleges (particularly public or private nonprofit institutions), as shown by the Senate Majority Leader’s recent efforts to exempt a Kentucky technical college from losing Title IV aid and the previous administration’s alteration of CDR calculations just prior to release in 2014 that protected an unknown number of colleges.[v]
A more effective way to hold a larger number of colleges accountable for their outcomes is to use a gradually increasing set of sanctions for lower-performing institutions. In theory, risk-sharing proposals for federal student loan repayment can provide that sort of incentive. However, the PROSPER Act’s loan repayment metric would create the same all-or-nothing incentive that would be subject to both institutional gaming and intense lobbying efforts. The Student Protection and Success Act creates a sliding scale to some extent (although retaining a minimum eligibility threshold), and academics’ risk-sharing proposals also are based on sliding scales.[vi] It is also important to note that risk-sharing proposals should include incentives for institutional improvement as well as sanctions, similar to what the ASPIRE Act would do.
Point 2: Both institution-level and program-level accountability policies are important. Policy conversations are rapidly moving toward holding individual programs within colleges accountable for their performance. Gainful employment regulations already seek to do that for a subset of programs, but the PROSPER Act would use program-level loan repayment rates for all institutions of higher education. This proposal makes intuitive sense, but program-level data collection efforts have some important limitations.
In general, programmatic outcomes data make the most sense when students enter a college or university with a particular field of study in mind. This is less of a concern for vocationally-oriented programs at the undergraduate level and for graduate and professional education in which students are generally admitted to study in particular programs. But not all students enter associate or baccalaureate degree programs with a declared major, and roughly one-third of first-time college students changed their declared major at least once within three years of starting college.[vii] This means that attributing student outcomes to a particular program becomes a concern. Additionally, if undeclared students are ignored for the purposes of program-level accountability metrics, colleges suddenly have an incentive to restrict when students can officially declare majors. Waiting until two years into a bachelor’s degree program to declare a major restricts the pool of students to those with a higher likelihood of success, meaning that dropouts are less likely to be counted.
Another potential option is to restrict program-level accountability only to students who graduate, as is the case with the current gainful employment regulations. But this obscures important data for students, since only 54% of students at four-year colleges and 32% of students at two-year colleges graduated from that same institution within eight years of initial enrollment.[viii] It is likely the case that reported program-level outcomes are far better for graduates than dropouts, thus providing an overly rosy picture of lower-performing programs.[ix]
Given the interest in program-level outcomes data alongside the difficulty in fully relying on program-level accountability measures in certain sectors of higher education, a more reasonable solution would be to use a combination of program-level and institution-level data for accountability purposes. It may be worthwhile to consider tougher performance measures for entire institutions than individual programs due to the difficulty in accurately measuring programmatic outcomes in non-vocational fields and due to concerns about small cell sizes for certain programs of study.
Point 3: Defining the loan repayment rate is perhaps the most important accountability-related issue in HEA reauthorization. Very few academics consider CDRs to be a tremendously valuable measure of institutional performance due to their ability to be manipulated by colleges, the presence of income-driven repayment programs, and their relatively short time horizon. The student loan repayment rate that was included in the 2015 release of the College Scorecard represented a more comprehensive look at how former students are managing their loans, and painted a completely different pictures than CDRs (especially after an unfortunate coding error was finally fixed in early 2017).[x]
Both the definition of student loan repayment rates in the College Scorecard and the types of loans included are decisions that have substantial accountability implications. The Scorecard definition (repaying at least $1 in principal at 1, 3, 5, and 7 years after entering repayment) includes federal subsidized and unsubsidized loans, omitting Parent and Grad PLUS loans. Approximately $21 billion of the $94 billion in federal loans during the 2016-17 academic year was in the form of PLUS loans, yet this is entirely missing from the Scorecard repayment rate (and CDRs, as well).[xi] It may be worth considering a separate loan repayment rate metric for Parent PLUS loans, but Grad PLUS loans should be included with other student loans for accountability purposes.
There are two other potential definitions of loan repayment rates that are worth considering. The first is the percentage of dollars that are repaid during a certain period of time. This is similar to the initial definition of repayment rates that was used in the 2010 negotiations regarding gainful employment.[xii] This is a more taxpayer-focused metric, as it captures overall risk of nonrepayment instead of the percentage of borrowers who are struggling to pay down principal. The second definition is the percentage of students who are on track to repay their loans within a fixed window of time. The challenge with this definition is that students can choose from a menu of loan repayment plans, with extended payment plans being particularly common among students with larger amounts of debt.
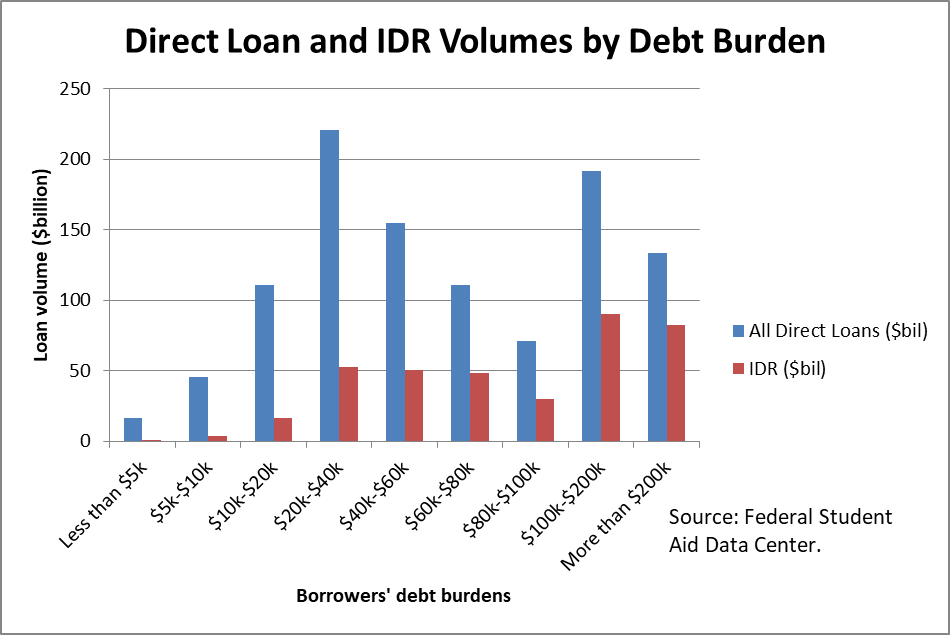
A further complicating factor is the growth of income-driven repayment plans, which now represent about 40% of all outstanding federal student loan dollars.[xiii] These plans often result in outstanding balances rising in early years of repayment (when incomes are low) before principal is paid down later. An analysis of recent bachelor’s degree recipients found that only about 25% of students in income-driven plans paid off any principal within five years of entering repayment, while about 75% of students not in income-driven repayment had repaid principal within one year of entering repayment.[xiv] How to address students in income-driven repayment plans is a key concern regarding student loan repayment rates, as the federal government could simultaneously encourage students to enroll in income-driven plans while penalizing colleges where students take up such plans.
Point 4: Free the higher education data! Students and their families are currently being asked to make one of the biggest financial decisions of their lives based on relatively little objective information. The College Scorecard was a helpful step forward, as was including part-time and Pell recipient graduation rates in the Integrated Postsecondary Education Data System in 2017. A student unit record data system would certainly be helpful in making better data available in the college choice process, but there are things that the Department of Education can do (with the support of Congress) without overturning the ban. A few of the most important data points are the following:
- Program-level outcomes for all Title IV institutions. Regardless of how the gainful employment negotiated rulemaking panel turns out, HEA reauthorization should encourage data to be released for all programs of study (with the caveats as noted earlier in this letter). Some programmatic accreditors are starting to require institutions to release this sort of information, but ED can do so fairly easily for all students receiving federal financial aid. It would be nice to include all students attending Title IV-participating institutions, but program-level data for federal aid recipients would be a good start.
- Separate data for undergraduate and graduate students. Although graduate and professional students represent just 17% of all federal student loan borrowers, they make up 38% of all federal student loan dollars.[xv] Yet loan repayment and debt data are not presented separately for graduate students—and current data do not even include Grad PLUS loans.
- Include outcomes for Parent PLUS loans. Although only five percent of students had a Parent PLUS loan in the 2011-12 academic year, this is still an important financing source for families; borrowing rates are higher (13%) at HBCUs and average loan amounts among borrowers are over $12,000.[xvi] Yet the only information available on PLUS loan outcomes is a set of sector-level default rates that ED released following a negotiated rulemaking panel in 2014.[xvii] It is more difficult to envision a high-stakes accountability policy based on parent outcomes instead of student outcomes, but making institution-level data public would be a valuable service to families.
- Provide data on income–driven repayment plan usage by institution. Because repayment rates are affected by income-driven repayment plans, it would be helpful to provide information on the percentage of borrowers from each institution who are enrolled in income-driven repayment plans, ideally at the undergraduate and graduate level. A lower repayment rate at a college that graduates a large percentage of students into public service may be more acceptable due to income-driven repayment plans, while a similar repayment rate at a college where students are enrolled in more lucrative majors would be a greater cause for concern.[xviii]
I would like to thank the HELP Committee for holding a series of hearings on Higher Education Act reauthorization and for actively engaging with the research community throughout the process. As the committee is drafting the bill over the next few months, so I encourage Senators and staff members to continue reaching out to researchers while considering potential policy proposals and legislative text. I am more than happy to talk with any committee members during this process and I wish you all the best of luck in working on a much-needed overhaul of the Higher Education Act.
———————————————————–
[i] All views and opinions expressed in this letter are mine alone and do not necessarily reflect my employer.
[ii] See my new book Higher Education Accountability, which is now available through Johns Hopkins University Press.
[iii] Author’s calculations using Federal Student Aid data on cohort default rates (FY14 cohort) and proprietary school revenue percentages (2015-16). Additionally, I appreciate the majority staff referencing one of my blog posts on the topic—that made my day!
[iv] Lederman, D. (2017, June 21). Where winds are blowing on accreditation. Inside Higher Ed. https://www.insidehighered.com/news/2017/06/21/bright-line-indicators-student-outcomes-dominate-discussion-federal-accreditation.
[v] Douglas-Gabriel, D. (2018, February 8). McConnell attempts to protect two Kentucky colleges in budget deal. The Washington Post. https://www.washingtonpost.com/news/grade-point/wp/2018/02/08/mcconnell-attempts-to-protect-two-kentucky-colleges-in-budget-deal/?utm_term=.a5e47c2fb77e. Stratford, M. (2014, September 24). Reprieve on default rates. Inside Higher Ed. https://www.insidehighered.com/news/2014/09/24/education-dept-tweaks-default-rate-calculation-help-colleges-avoid-penalties.
[vi] Kelchen, R. (2015). Proposing a federal risk-sharing policy. Indianapolis, IN: Lumina Foundation. Webber, D. A. (2017). Risk-sharing and student loan policy: Consequences for students and institutions. Economics of Education Review, 57, 1-9.
[vii] Leu, K. (2017). Beginning college students who change their majors within 3 years of enrollment. Washington, DC: National Center for Education Statistics Report NCES 2018-434.
[viii] Ginder, S. A., Kelly-Reid, J. E., & Mann, F. B. (2017). Graduation rates for selected cohorts, 2008-13; outcome measures for cohort year 2008; student financial aid, academic year 2015-16; and admissions in postsecondary institutions, fall 2016. Washington, DC: National Center for Education Statistics Report NCES 2017-150rev.
[ix] There is an argument that students want outcomes of graduates only instead of combining graduates and dropouts, given common complaints about College Scorecard data and the common trend of students overstating their likelihood of graduation. But for an accountability system tied to federal financial aid instead of consumer information, the proper sample may differ.
[x] Kelchen, R., & Li, A. Y. (2017). Institutional accountability: A comparison of the predictors of student loan repayment and default rates. The ANNALS of the American Academy of Political and Social Science, 671, 202-223.
[xi] Baum, S., Ma, J., Pender, M., & Welch, M. (2017). Trends in student aid. New York, NY: The College Board.
[xii] Belfield, C. R. (2013). Student loans and repayment rates: The role of for-profit colleges. Research in Higher Education, 54(1), 1-29.
[xiii] Author’s analysis using Federal Student Aid data.
[xiv] Conzelman, J. G., Smith, N. D., & Lacy, T. A. (2016, July 11). The tension between student loan accountability and income-driven repayment plans. Brown Center Chalkboard. https://www.brookings.edu/blog/brown-center-chalkboard/2016/07/11/the-tension-between-student-loan-accountability-and-income-driven-repayment-plans/.
[xv] Baum, S., & Steele, P. (2018). Graduate and professional school debt: How much students borrow. West Chester, PA: AccessLex Institute.
[xvi] Goldrick-Rab, S., Kelchen, R., & Houle, J. (2014). The color of student debt: Implications of federal loan program reforms for black students and historically black colleges and universities. Madison, WI: Wisconsin HOPE Lab.
[xvii] Stratford, M. (2014, April 3). Default data on Parent PLUS loans. Inside Higher Ed. https://www.insidehighered.com/news/2014/04/03/education-department-releases-default-data-controversial-parent-plus-loans.
[xviii] It would be helpful to have data on Public Service Loan Forgiveness interest by institution, but these data would be incomplete because students do not have to signal any intent to use the program until they officially apply after making 120 qualifying payments.

 Ben is perhaps best known for his incredible work with data—and for his willingness to share his code and materials with the general public. (More scholars should be doing this!) For example, the “code” page of his website includes helpful packages to help download and manage the massive College Scorecard dataset and how to work with LaTeX files. He has also put together some interesting data visualizations of college opportunity that look great and tell a compelling story. There is also quite a bit of material on his GitHub page, which is a great way to work with large data files (and something that I probably should learn at some point).