In the midst of the current economic climate and the rising sticker price of attending college, more people are paying attention to the net price of attendance. The federal government collects a measure of the net price of attendance in its IPEDS database, which is calculated as the total cost of attendance (tuition, fees, room and board, and other expenses) less any grant aid received. Since the 2008-2009 academic year, they have collected the average net price by family income among students who receive federal financial aid. In this post, I examine the trends in net price data by type of institution (public, private nonprofit, and for-profit) among four-year colleges and universities (n=1753).
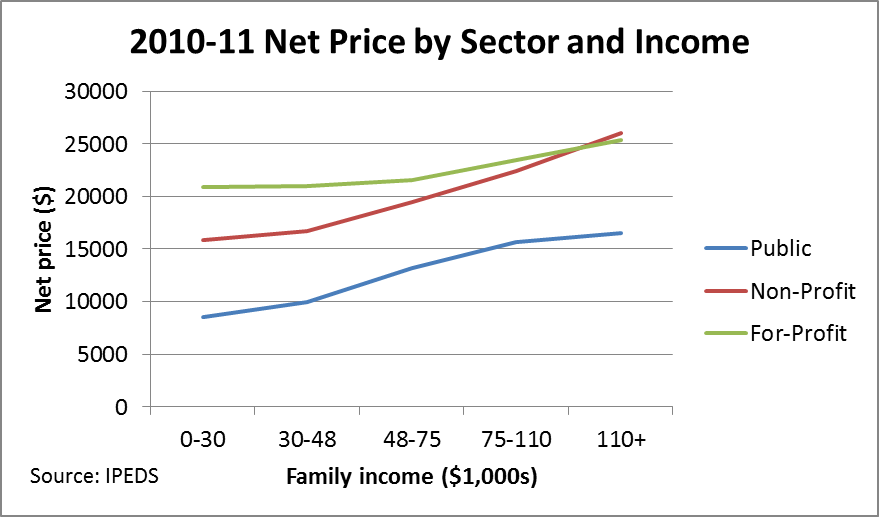
The first figure shows the average net price that families faced in the 2010-11 academic year (the most recent year available) by family income bracket. This nicely shows the prevalence of tuition discounting models, in which institutions charge a fairly high sticker price and then discount that price with grant aid. (Part of the discount in the lowest two brackets is also state and federal need-based grant aid.)
The next figure shows the net price trends over the period from 2008-09 through 2010-11 for the lowest (less than $30,000 per year) family income bracket.
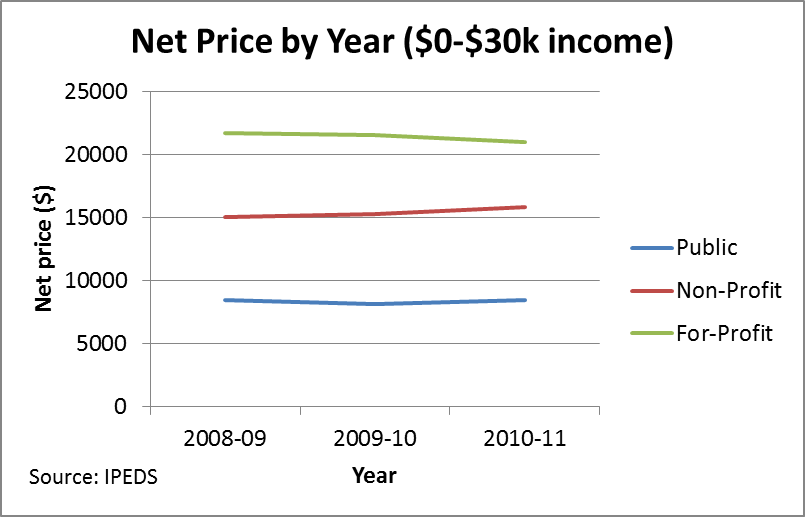
It is worth noting that the public and for-profit sectors largely held the net price for students from the lowest-income families constant over the three-year period (0.6% and -3.2%, respectively), while nonprofit colleges increased the net price by 5.6% during this time. This might show an institutional commitment to keeping the net price relatively low for the neediest students, but also keep in mind that the maximum Pell Grant increased from $4,041 to $5,273 during this period. Colleges may not have changed their effort, but instead relied on additional federal student aid. The uptick in the net price at private nonprofit universities may have been a function of pressures on endowments that restricted institutional financial aid budgets.
The final figure shows the net price trends for the highest family income bracket (more than $110,000 per year)—among students who received federal financial aid.
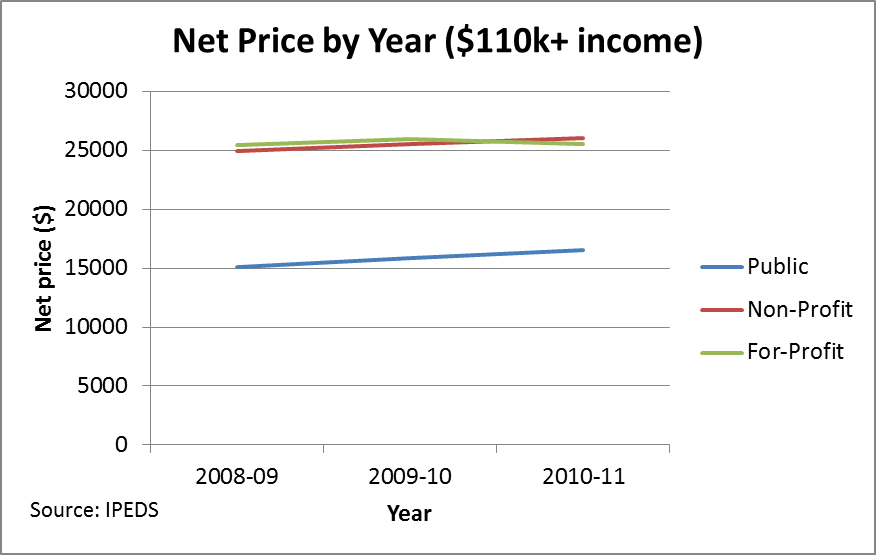
Three observations jump out here. First of all, the net prices for nonprofit and for-profit universities are nearly identical for the highest-income students. This shows the financial model for nonprofit education, in which “full-pay” students are heavily recruited in order to pay the bills and to help fund other students. Second, the average net price at public universities increased by 9.4% during this period for the highest income students, compared to only 4.6% at nonprofit and 0.4% at for-profit institutions. As per-student state appropriations declined during this period, public institutions relied more on tuition increases and recruiting out-of-state and foreign students if at all possible. Finally, the flat net price profile of for-profit colleges across the income distribution is worth emphasizing. It seems like these colleges have reached a point at which additional increases in the price of attendance will result in net revenue decreases.
I would love to hear your feedback on these figures, as well as suggestions for future analyses using the net price data. I am eagerly awaiting the 2011-12 net price data, but that may not be available until this fall.