I am a professor at the University of Tennessee, Knoxville who studies higher education finance, accountability policies and practices, and student financial aid. All opinions expressed here are my own.
As someone who spends a lot of time thinking about some of the wonkier issues of higher education finance, there are some common statements that just drive me nuts. For example, people who refer to the U.S. Department of Education as the “DOE” (it’s “ED” and the Department of Energy is “DOE”) or pronounce the FAFSA as “FASFA” might as well be screeching their fingernails on a chalkboard. But, as much as those things annoy me, they’re examples of inside baseball at their finest—they don’t affect students, but they’re still deviations from the norm. So I’ll try to hide my grimaces in those situations going forward.
However, I will say something every time someone erroneously refers to the cost of college when they truly mean the price of college, as these are two distinctly different concepts. Here are the definitions of the two terms:
Price: This represents how much money a student and/or their family has to pay for college.
Cost: This represents how much money it takes to provide an education.
With the presence of federal, state, and institutional financial aid as well as direct state appropriations to colleges, the price that many students pay can be far below the true cost of providing the education. On the other hand, due to the tangled web of subsidies present in the “awkward economics” of higher education, some students (such as full-freight international students and master’s students as well as those enrolled in large lecture classes) may be paying far more than it costs to provide their education.
From a policymaker’s perspective, it if far easier to propose bringing down the price of college than the cost of college—even though these proposals have large price tags and finding funding can be difficult. (An exception is so-called “last dollar” programs at community colleges, which often leverage other grant aid sources instead of using much of their own money.) Bending the cost curve is a far more difficult endeavor, as technology generally hasn’t done much to reduce costs (a promising master’s degree program at Georgia Tech notwithstanding) and other options such as increasing class sizes or spending less on facilities frequently run into opposition.
Efforts to bring down the price of college have become increasingly popular over the last several years, but they must be accompanied with a willingness to reduce costs in order for these programs to be financially feasible in the long run. To this point, cost control has remained a distant goal for most policymakers—a perfectly reasonable position given the shorter time horizons of most politicians. Bringing down prices today gets attention, while the crucial step of bringing down costs in the future is nowhere near as exciting.
Student loan debt in the United States is now over $1.25 trillion, nearly three times as much as just a decade ago. The typical student graduating with a bachelor’s degree with debt (about 70 percent of all students) now owes between $30,000 and $40,000 for their education, about twice as much as a decade ago. Although taking on modest amounts of debt in order to pay for college is generally a good bet in the long run, colleges with similar admissions standards and resource levels leave students with different amounts of debt.
College Scorecard data highlight the large amount of variation in what high-debt undergraduate students borrow across colleges with similar admissions criteria.1 The figure below shows the distribution of the 90th percentiles of debt burdens (in 2016 dollars) for students who left 1,156 four-year public and private nonprofit colleges in 2006 or 2007, broken down into three selectivity categories.2 Not surprisingly, the most selective colleges, which have the resources to offer more scholarships and fewer students with financial need, have lower debt burdens than somewhat selective or less selective colleges. These differences in borrowing by selectivity are larger than by type of college, as median debt at public colleges was only about $2,400 more than at private nonprofit colleges.
Attending college and taking on $40,000 or even $50,000 in debt can be an outstanding investment in a student’s future—but only if students from that college actually end up getting good jobs. I then examined the relationship between 90th percentile debt burdens upon leaving college in 2006 and 2007 and the median earnings of students in 2011 and 2012 who began college in 2001 and 2002.3 The figure below shows that colleges that tend to have higher amounts of student debt also tend to have lower earnings in later years, which is in part due to student characteristics and their prior family income rather than the causal impact of the college. The correlation coefficient between debt and earnings is about -0.35 overall, but between -0.10 and -0.20 within each selectivity group. This suggests that colleges with higher debt burdens also have higher earnings, but much of the relationship between debt and earnings can be explained by selectivity.
An old rule of thumb in paying for college is that students should not borrow more for a bachelor’s degree than they expect to earn one year after graduation. Although the presence of income-driven repayment programs allows students to repay their federal student loans even if they make less money, the debt-to-income ratio is still a useful way to judge colleges. The final figure shows the distribution of colleges’ debt-to-income ratios using the initial debt upon leaving college for high-debt students and annual earnings approximately five years later. A ratio over 1 at this point is a major concern, as earnings should grow considerably during a student’s first few years after college.
Few high-debt students at the most selective colleges likely have issues making enough money to repay their loans, as just one of the 191 colleges in this category had a debt-to-earnings ratio above 1. Just under 15 percent of the somewhat selective colleges had ratios above 1, while about one-third of the least selective colleges had ratios above 1. This reflects the fact that financially-struggling students who attend less selective colleges (roughly 13% of the undergraduates in my sample, or about 800,000 students) take on more debt and earn less money than high-debt students at highly-selective colleges.
With student debt being a growing concern among Americans and playing a key role in the presidential campaign, students and their families are wise to consider the likely return on their investment in higher education. As the data show, some colleges do leave their former students with less debt than other similar colleges. But among less-selective colleges that enroll large numbers of lower-income or minority students, some amount of debt is almost unavoidable. Students should not seek to avoid all debt, but they should be mindful that even among broad-access institutions, colleges vary in how much debt their students take on.
———————————————————-
1 Debt and earnings data from the College Scorecard combine students who graduate with those who dropped out.
2 Colleges in the Barron’s categories of special, noncompetitive, and less competitive are in my lowest selectivity tier (n=195), colleges in the competitive, competitive-plus, and very competitive categories are in the middle tier (n=770), and all others are in the highest tier (n=191).
3 The College Scorecard does not track debt burdens by when students started college (only when they left), so I estimated that students either graduated or left college in about five years.
Tonight is the first presidential debate of the 2016 general election season, and this clash between Democrat Hillary Clinton and Republican Donald Trump could top 100 million viewers. (I won’t be one of them, as I’m teaching tonight.) The host site, Hofstra University, is actually the second choice—as Wright State University pulled out over the high price tag this summer. Hofstra is paying about $5 million to host the debate, with the costs generally covered through three donors.
Hosting a presidential debate is undoubtedly a great public relations opportunity for a university, similar to making a big run in the NCAA basketball tournament or making a big football bowl game. Some research has shown that big-time athletics success is associated with increased student applications in the following year, so the media circus following a presidential debate (Hofstra is trending on Twitter as I write this post) could have similar results.
Hofstra also hosted a presidential debate in 2012, so I looked at what happened to the number of applications they received before and after the debate compared to their defined group of peer institutions. The data are below:
Name
2011-12
2012-13
2013-14
Pct increase, 2012-13 to 2013-14
Adelphi University
8278
9184
8654
-5.8%
American University
18706
17039
17545
3.0%
Boston University
38275
41802
44006
5.3%
Drexel University
48450
40586
43945
8.3%
Fordham University
31792
34070
36189
6.2%
George Washington University
21433
21591
21756
0.8%
Hofstra University
18909
21376
22733
6.3%
Ithaca College
13436
13813
15658
13.4%
LIU Post
7369
7209
6001
-16.8%
Marist College
11399
11466
10351
-9.7%
New York University
41243
42807
45779
6.9%
Northeastern University
43255
44208
47364
7.1%
Pace University-New York
10623
11778
12885
9.4%
Quinnipiac University
18651
18825
20699
10.0%
Seton Hall University
6436
10180
10735
5.5%
St John’s University-New York
54871
52972
51634
-2.5%
Syracuse University
25884
25790
28269
9.6%
Hofstra did see a 6.3% increase in applications between 2012-13 and 2013-14, compared to a 4.6% increase across its peer institutions. But other peers, such as Ithaca, Quinnipiac, Syracuse, and Pace saw even larger increases. So it appears that the debate brought plenty of pride to Hofstra, but there was not an unusual jump in applications after the debate aired.
I wrote the below letter to the editor of the Star-Ledger, New Jersey’s largest newspaper, in response to a truly woeful editorial piece that they recently published on student loan debt. (Note: They eventually ran the letter, but here is a slightly revised version for your enjoyment.)
—————————————————————————
As a college professor who researches the implications of student loan debt, I was dismayed to read the Star-Ledger Editorial Board’s recent piece titled “Why we should all be terrified of student loans.” Yes, the $1.25 trillion in outstanding student loan debt is a concern, but the typical amount borrowed for a bachelor’s degree is more manageable—about $30,000 per student. Students who borrow from the federal government can also enroll in income-driven repayment programs that allow them to make small or no payments if their income is low.
The “terrified” headline has the potential to scare students and their families away from making a worthwhile investment in college. Research shows that low-income, first-generation, and minority students are particularly averse to borrowing for college, even when borrowing a reasonable amount of money would help them attend and graduate college. Students and their families should be careful about taking on too much debt, particularly from programs like New Jersey’s state student loan system that do not allow payments to be tied to the student’s income. But students should not be terrified of taking out modest loans from the federal government to make college a reality.
Given that some of the concerns about ITT Tech were about poor student outcomes, I examined ITT Tech’s outcomes relative to other degree-granting for-profit colleges on three important metrics: median debt burdens of former students who took out loans, the percentage of students seven years after entering repayment, and median earnings of former students ten years after entering college.1 I restricted my analysis to the 415 degree-granting for-profit colleges that reported data on all three of the outcomes, combining branch campuses that reported the same outcomes as other colleges in the same system.2
Median debt
The median debt burden of all former ITT Tech borrowers was $12,473 (as indicated by the red line on the below chart), slightly above the median amount of $11,993. This suggests that among for-profit colleges granting associate and/or bachelor’s degrees, ITT Tech’s debt burden was fairly typical.
Loan repayment rates
Seven years after entering repayment, 58.2% of former ITT Tech students paid down at least $1 in principal on their federal student loans. This is slightly worse than the median rate of 61.3% across similar for-profit colleges.
Earnings
On this metric, ITT Tech looks pretty good relative to other for-profit colleges. ITT Tech students who received federal financial aid had median earnings of $38,400 ten years after college entry, well above the median of $29,200 and close to the 90th percentile among similar institutions. However, these data are based on students who entered college in the early 2000s, when ITT Tech looked much different than it did in recent years.
Based on financial outcomes, ITT Tech’s former students (at least those who enrolled at least several years ago) did as well or better than other for-profit colleges. This does lend some credence to defenders of ITT Tech who were concerned about the Department of Education targeting the institution. However, others have noted that ITT Tech’s closure may have been self-inflicted through an ill-advised private loan program that led to fraud charges. In any case, other for-profit college chains are likely to face additional scrutiny in the future—from politicians and accreditors alike.
——————————————————————————————————–
1 I did not examine graduation rates, as many for-profit colleges have very few students in the first-time, full-time cohort of students that are currently used to calculate graduation rates for the federal government.
2 ITT Tech had 143 branch campuses in the College Scorecard data, and 141 of them had the same reported outcomes. I analyzed those campuses as a single institution, dropping the two small campuses that had different reported outcomes.
As a shareholder of the Green Bay Packers, I keep an eye on what Butte Community College’s most famous student-athlete has to say. Packers quarterback Aaron Rodgers famously told fans in “Packer-land” in 2014 to “R-E-L-A-X” after the team got off to an uncharacteristically slow 1-2 start. Fans relaxed after the team went 11-2 the rest of the way in the regular season as Rodgers played like his regular self.
In the education policy niche of the world, few things get people more upset than declining standardized test scores. Last year, I wrote about the fuss about SAT scores declining—and how at least part of that decline is due to more students taking the test instead of the American education system failing young adults. Now it’s ACT’s turn to release their newest scores—and my message again is R-E-L-A-X.
Between 2015 and 2016, average ACT scores declined from 21.0 to 20.8 nationwide, the lowest score in at least five years. But as the now-dominant test in the United States (much to the surprise of many folks who grew up on a coast where the SAT is still common), the percentage of students taking the ACT rose from 52% in 2012 to 59% in 2015 and 64% this year. This sharp increase in ACT takers is in large part due to more states requiring all students to take the ACT as a graduation requirement. In 2016, all graduating high school seniors took the ACT in 18 states, up from 13 states in 2015.
The five states that required all students to take the ACT for the first time in 2016 all saw large decreases in their average scores, as shown below. Wisconsin, Missouri, and Minnesota all had about 75% of their students taking the ACT in 2015 and had drops of about 1.5-1.7 points when all students took the test, with South Carolina having a drop of 1.9 points as the last 38% of students took the test. Nevada had a decline of 3.3 points in 2016, but the percentage of students taking the ACT more than doubled.
State
Pct tested (2016)
Avg score (2016)
Pct tested (2015)
Avg score (2015)
Nevada
100
17.7
40
21.0
South Carolina
100
18.5
62
20.4
Wisconsin
100
20.5
73
22.2
Missouri
100
20.2
77
21.7
Minnesota
100
21.1
78
22.7
Among the other 45 states that had very small changes in ACT participation rates, the average change in scores at the state level (not weighted for size) was effectively zero. So R-E-L-A-X about test score declines when they are due to more students taking the test (some of whom won’t be going to college, anyway) instead of collegegoing students suddenly performing worse.
The traditional way to repay federal student loans was for students to pay back their loans over a ten-year period of time, generally by making the same payment each month. But as student loan debt has generally risen over time (although falling ever so slightly in the most recent quarter), paying off larger loans in a short period of time has become more difficult for many borrowers. This has made income-driven repayment plans, expanded during both the Bush and Obama Administrations, an appealing option for more students (although the future price tag of the programs is something to watch closely in the future).
The U.S. Department of Education recently released new data (updated every three months) on the federal student loan portfolio showing the growth in income-driven plans. The chart below shows the percentage of dollars in the Direct Loan program that are in one of four broad categories: 10-year payment plans not tied to income, longer payment plans not tied to income, income-driven plans, and miscellaneous plans that don’t fit well in any of the above three categories.1
Since 2013 (when repayment plan data first became available), the federal government’s holdings in the Direct Loan program have risen from $361 billion to $673 billion. The amount of loans in the standard ten-year repayment plan rose from $168 billion to $267 billion during this time, but the amount in income-driven plans rose from $72 billion to $269 billion in just three years. Income-driven plans now make up 40.0% of all Direct Loan dollars, while 39.7% of dollars are now in ten-year plans.
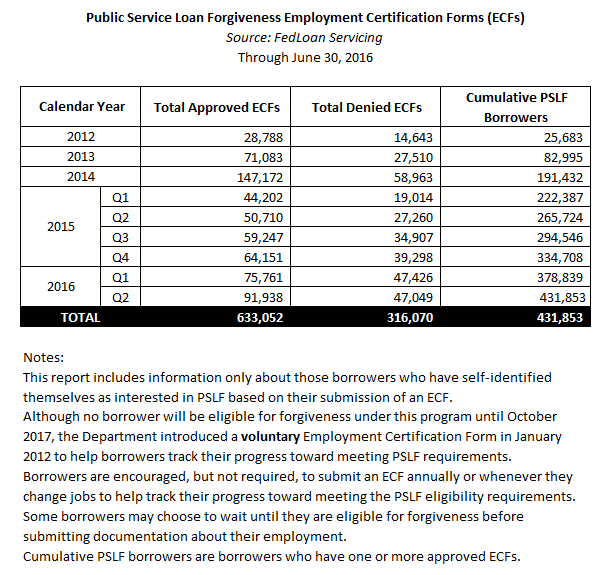
The Department of Education also released data for the first time on the number of students seeking employment certification in the Public Service Loan Forgiveness (PSLF) program, which will allow students working in approved fields to make ten years of payments instead of 20-25 years under other income-driven plans. While students aren’t officially in PSLF until they complete ten years of payments (the first students will do so in October 2017), this is an interesting measure of potential interest in PSLF. The below figure (from Federal Student Aid) shows the number of students who have submitted employment certification forms in possible preparation for receiving PSLF.
Notably, about one-third of all requests have been denied to this date, suggesting that quite a few students will get an unpleasant surprise when they go apply for PSLF in the next few years. But at least 430,000 students look to be on track for PSLF at this point—a number that is likely a significant understatement of the number of applications that the federal government will receive.
1 The Direct Loan program represents about 90% of all loans held by the federal government. The other 10% are in the older Federal Family Education Loan (FFEL) program, which has not disbursed new loans in years but has about one-third of its loan dollars in income-based plans. I excluded FFEL here because repayment plan data are only available for 2016.
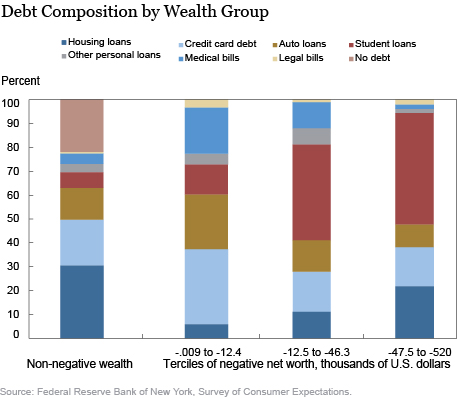
A recent analysis by economists at the Federal Reserve Bank of New York looked at the approximately 14% of American households that had negative wealth in 2015 and pointed out student loan debt as a key driver of negative wealth. As a key figure from the report (which is reprinted below) shows, student loan debt is responsible for between 40% and 50% of total negative wealth among households with a net worth of below -$12,500.
This isn’t a tremendously surprising finding, although it’s always helpful to document something intuitive with actual data (although self-reported data always come with caveats). Student loans are one of the few types of debt aside from medical or legal bills that can be taken on in large amounts without having outstanding credit or collateral. Credit card debt is another way to take on debt, but most people with negative wealth won’t be able to access large lines of credit this way. It’s also possible to be underwater on a house (by owing more than its current value), but this affects a relatively small percentage of households.
The authors of the analysis then wrote the following about the implications of student loan debt:
“It is likely that the steady growth in student debt and borrowing, combined with the very slow rate of student loan repayment we have documented elsewhere, has materially contributed and will continue to contribute to negative household wealth and wealth inequality.”
As I told Inside Higher Edin their summary of the analysis, I only partially agree with that assessment. The challenge with this analysis is that it combines students who completed and did not complete a degree (likely due to sample size issues, as the dataset includes questions about educational attainment). As the authors note, households with a bachelor’s degree or higher and negative net worth tend to have a young head of household. For example, my household is just now leaving negative net worth territory, five years after our head of household completed law school.1 Paying off student loan debt is difficult, but the rapid growth in takeup of income-driven repayment plans among high-debt individuals (as shown in this recent White House report and in the chart below) has the potential to reduce this burden.
I’m far more concerned about the implications for wealth inequality among students who did not complete a degree and are unaware of income-driven repayment options. Although there are positive economic returns on average for students who attend college but do not graduate, they are far smaller than students who finish. A better measure of wealth inequality would look at how wealth progresses over a ten-year window after a student leaves college. If he or she is able to repay loans and build assets, the picture is far less bleak than if a student still has negative wealth due to student loans and other types of debt.
———————————————————————————————————
1 In 2016, the term “head of household” is outdated. In households where both adults work, it’s far from clear who should be the head and who isn’t. It would be better to know the highest educational attainment of either of the adults.
Ahead of the Democratic National Convention – on July 5 – Hillary Clinton announced a set of new proposals on higher education. Key measures included eliminating college tuition for families with annual incomes under US$125,000 and a three-month moratorium on federal student loan payments.
Clinton’s original plan had called for the federal government and states to fund public colleges so students wouldn’t have to borrow to cover tuition if they worked at least 10 hours per week.
As a researcher of higher education finance, my question is whether these proposals, estimated to cost $450 billion over the next 10 years, will benefit enough of the over 10 million college-going voters struggling to repay loans.
How student loan interest rates work
Typically, students pay interest rates set by Congress and the president on their federal student loans.
Over the last decade, interest rates for undergraduate students have fluctuated between 3.4 percent and 6.8 percent. Rates for federal PLUS loans have ranged from 6.3 percent to 8.5 percent. Federal PLUS loans require a credit check and are often cosigned by a parent or spouse. Federal student loans do not have those requirements.
It is also important to note the role of private loan companies that have recently entered this market. In the last several years, private companies such as CommonBond, Earnest and SoFi as well as traditional banks have offered to refinance select students’ loans at interest rates that range from two percent to eight percent based on a student’s earnings and their credit history.
However, unlike federal loans (which are available to nearly everyone attending colleges participating in the federal financial aid programs), private companies limit refinancing to students who have already graduated from college, have a job and earn a high income relative to the monthly loan payments.
Analysts have estimated that $150 billion of the federal government’s $1.25 trillion student loan portfolio – or more than 10 percent of all loan dollars – is likely eligible for refinancing through the private market – much of it likely for graduate school.
Many Democrats, such as Senator Elizabeth Warren of Massachusetts, have pushed for all students to receive lower interest rates on their federal loans for years. Republican nominee Donald Trump too has questioned why the federal government profits on student loans – although whether the government actually profits is less clear.
Issues with refinancing of loans
Interest rates on student loans were far higher five to 10 years ago (ranging from 6.8 percent to 8.5 percent based on the type of loan). Allowing students to refinance at current rates ranging from 3.76 percent to 6.31 percent would mean that some students could possibly lower their monthly payments.
But the question is, how many students will benefit from the refinance?
Struggling borrowers are likely the ones with least debt. Robert Galbraith/Reuters
Students with the most debt are typically college graduates and are the least likely to struggle to repay their loans. In addition, they can often refinance through the private market at rates comparable to what the federal government would offer.
Struggling borrowers, on the other hand, already have a range of income-driven repayment options through the federal government that can help them manage their loans. Some of their loans could also be forgiven after 10 to 25 years of payments.
Furthermore, the majority of the growth in federal student loans is now in income-driven plans, making refinancing far less beneficial than it would have been 10 years ago. Under income-driven plans, monthly payments are not tied to interest rates.
So, on the face of it, allowing students to refinance federal loans would appear to be beneficial. But, in reality, because of the growth of private refinancing for higher-income students and the availability of income-driven plans for lower-income students, relatively few students would likely benefit.
Why implementing a moratorium will be hard
On the proposed three-month moratorium, Clinton has said she could proceed on it via executive action as soon as she takes office – potentially making it the most important part of her plan.
During these three months, the Department of Education and companies servicing student loans would reach out to borrowers to help them enroll in income-driven plans that would reduce monthly payments.
So, would a moratorium on student loan payments help struggling borrowers?
The challenge is that reaching out to each and every one of the estimated 41.7 million students with federal student loans in a three-month period would be a Herculean task given the Department of Education’s available resources.
Currently, about one-fifth of the federal government’s student loan portfolio, or $260 billion is in deferment or forbearance, meaning that students are deferring payments until later.
To put this another way, about 3.5 million loans are at least 30 days behind on payments, and eight million loans are in default. This could mean that those students haven’t made a payment in at least a year.
Just trying to contact 3.5 million students in a three-month window would be a difficult proposition, let alone contacting the millions of additional students who are putting off payments until later.
Currently eight million loans are in default. Andrew Burton/Reuters
There are also other issues that Department of Education staffers and loan servicers must deal with that may be more important than an overall repayment moratorium.
Nearly 60 percent of students who were enrolled in income-driven repayment plans fail to file the annual paperwork. That paperwork is necessary if students are to stay in those programs. And failure to do so results in many students facing higher monthly payments.
Focus needed on most in need students
In my view, Clinton’s proposals of allowing students to refinance their loans at lower rates through the federal government and a three-month moratorium on payments are unlikely to benefit that many students.
Hopefully, the Clinton campaign will focus later versions of the proposal on borrowers most in need of assistance. If not, this could present an opportunity for the Trump campaign to release a coherent higher education agenda.
In June, the U.S. Department of Education released a 530-page set of proposed regulations on the topic of ‘defense to repayment.’ Although this sounds like an obscure topic (and reading the document is no picnic!), these proposed rules, if adopted, could allow students to be able to have their student loan debt forgiven if colleges misrepresented themselves to students. The Department of Education is currently working through this process for former Corinthian Colleges students, and tens of thousands more students could be eligible under the proposed rules.
Although forgiving student loans has the potential to benefit many financially struggling students, this will likely come at a significant cost to taxpayers. The official cost estimate of the proposed rules is between $199 million and $4.23 billion, which reflects both the number of colleges expected to be subject to the regulations and the large amount of uncertainty in the final number of students affected. To guard taxpayer dollars, the Department of Education is also proposing increasing the number of reasons for which colleges will have to post letters of credit—bonds that the federal government can keep if a college closes in order to compensate former students.
Currently, colleges have to post a letter of credit if they have a low financial responsibility score or if there are serious governance or fraud concerns. But these proposed rules would extend posting letters of credit to private nonprofit and for-profit colleges that have “significant fluctuations” in their Pell Grant and student loan awards, with the definition of “significant” left to the Department of Education to determine. However, on page 358 of the proposed rules, the Department of Education noted that 991 of 3,590 private nonprofit and for-profit colleges had a change in student loan volume of 25% or more between the 2013-14 and 2014-15 academic year. I use this 25% change as a guide in this analysis, as well as looking at the changes in dollar values.
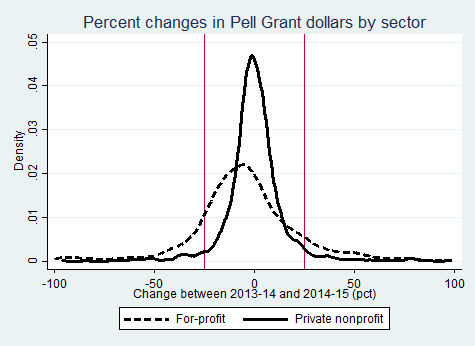
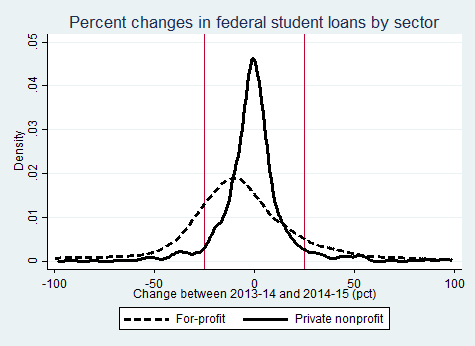
I used data from the Office of Federal Student Aid’s Title IV volume reports to look at the number of colleges with large changes in their Pell Grant and student loan awards between 2013-14 and 2014-15, with my sample consisting of 3,575 colleges that received Pell Grant and/or student loan dollars in both years.1 Of these colleges, 1,088 (30%) had at least a 25% change in Pell Grant or student loan dollars during this period. Much of this rate is driven by for-profit colleges, of which 43% saw large changes; just 15% of nonprofit colleges had similar changes.
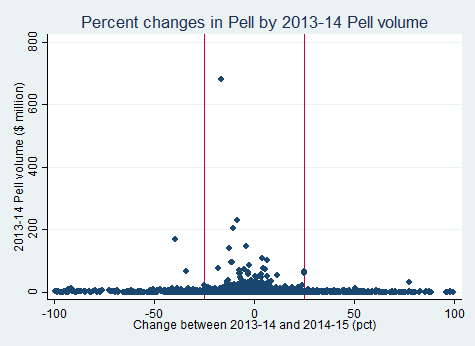
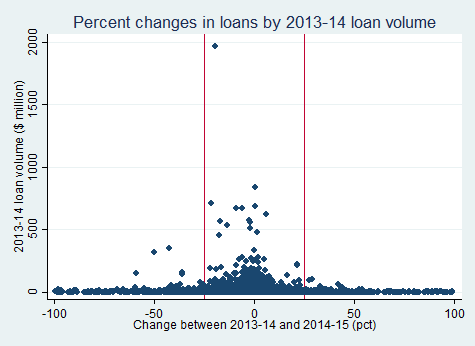
The tendency of for-profit colleges to have larger percentage changes in both Pell Grant and student loan awards can be seen in the below two charts, with the two red vertical lines representing changes of -25% and 25% between 2013-14 and 2014-15. It is also worth noting that the typical for-profit college saw a sizable decline in both types of aid, while the typical nonprofit college had little to no change in aid. This can be attributed to the rapid decline in enrollment at for-profit colleges over the past several years.
The drawback of using a metric based on the percent change in aid awarded is that very small institutions can have large percentage changes with relatively small dollar changes. The next two charts show that the vast majority of colleges with changes above 25% had relatively small amounts of federal aid in 2013-14. The median college with a change that could subject them to a letter of credit had about $250,000 in Pell Grant revenue or $550,000 in student loan revenue, which explains all of the dots right along the axis in the charts.
There were a small number of colleges with both sizable amounts of federal student aid in 2013-14 and large changes between 2013-14 and 2014-15. Ten colleges had more than $10 million in Pell Grants and a 25% change the following year, of which only two (nonprofit Southern New Hampshire University and for-profit United Education Institute) had gains. The eight colleges with large losses in Pell awards were all for-profits, and seven are now closed or under new ownership. The only one that is still open is Fortis College, which saw a 39% drop in Pell awards in just one year.
Colleges with large changes in Pell Grant awards, 2013-14 to 2014-15
Name
For-profit?
2013-14 Pell ($mil)
2014-15 change (pct)
Now closed?
Southern New Hampshire U.
No
31.5
+77.2
No
United Education Institute (UEI)
Yes
10.6
50.4
No
Florida Career College
Yes
22.7
-25.3
Yes
Sanford-Brown College
Yes
13.1
-33.0
Yes
Heald College
Yes
66.9
-34.1
Yes
Fortis College
Yes
12.6
-38.9
No
Everest University
Yes
169.0
-39.8
New owner
Wyotech
Yes
10.3
-41.1
New owner
Drake College of Business
Yes
12.3
-41.2
Yes
Anthem College
Yes
11.8
-91.6
Yes
Six colleges with more than $100 million in student loans in 2013-14 had changes of more than 25% in 2014-15, with just one college (for-profit Ultimate Medical Academy) seeing an increase of at least 25%. Of the five colleges with large declines, for-profits Everest University (now under new ownership) and Heald College (now closed) show up again, while nonprofits Loma Linda University, Webster University, and Southern New Hampshire University had large declines. SNHU is particularly interesting, as it saw a 77.2% increase in Pell dollars at the same time it saw a 43% drop in student loan dollars.
Colleges with large changes in student loans, 2013-14 to 2014-15
Name
For-profit?
2013-14 loans ($mil)
2014-15 change (pct)
Now closed?
Ultimate Medical Academy
Yes
100.9
28.7
No
Webster University
No
159.4
-36.0
No
Loma Linda University
No
143.6
-36.0
No
Southern New Hampshire University
No
346.1
-42.7
No
Everest University
Yes
317.1
-50.1
New owner
Heald College
Yes
150.5
-59.4
Yes
If the Department of Education sticks to the percentage change metric for examining which colleges should post letters of credit, the smallest colleges will be disproportionately affected. Meanwhile, the University of Phoenix, which received over $2.6 billion in Pell and loan revenue with declines of between 15% and 20% in both categories, would not face additional scrutiny even though more students would be affected by any changes. And by extension, more taxpayers would be liable in the case of a bailout of these students. As being unable to obtain a letter of credit may cause some colleges to close, the federal government should potentially consider a sliding scale based on a combination of initial enrollment or federal financial aid volume for considering percentage changes in aid received.
1 I was unable to perfectly match the number of colleges the Department of Education had in its analysis using publicly available data from the Office of Federal Student Aid. This likely leads me to slightly understate the number of colleges that could be affected, as the colleges not in my dataset are probably quite small or had stopped participating in federal financial aid programs during the period of analysis.