
The Year of Higher Education Policy in Review

As 2013 draws to a close, it’s time to take a look back at some of the biggest happenings (or non-happenings) of the year. Some of these items would have been on the list for several years, but others (including the top happening of the year) are brand-new for 2013. Enjoy the list!

10. There is still some hope in the academic job market. In spite of continued concerns about the working conditions of adjuncts (as exemplified in the case of former Duquesne adjunct Margaret Mary Vojtko—read both the original op-ed and a thoughtful retelling of her life story), the tenure-track job market may just be springing back to life after a few lean years. I’m thankful to be one of those success stories, as I got a great job offer from Seton Hall University before defending my dissertation at the University of Wisconsin-Madison. (Look at my faculty webpage…I’m bona fide and I love my job!) But, in other disciplines, the rough market continues.

9. We heard more noise about reauthorizing the Higher Education Act, but no action. The HEA, which dates back to 1965, is supposed to be renewed in 2014. And Congress is saying all the right things about renewing the HEA, including holding a series of hearings on reforming the Pell Grant. However, it is hard to find anyone in academia or the policy community who thinks that is likely. After all, No Child Left Behind (the Elementary and Secondary Education Act) expired in 2007. If I had to put money on a reauthorization date, I would go for 2017.

8. The higher ed policy world gets RADDical. During late 2012 and early 2013, 17 organizations and teams released white papers as a part of the Gates Foundation-funded Redesigning Aid Design and Delivery (RADD) project. The recommendations of the groups ranged widely (see this nice summary from the National Association of Student Financial Aid Administrators, one of the participating organizations), but all groups suggested substantial changes from the status quo. It’s worth noting that the recommendation shared across the largest number of reports is stabilizing or increasing Pell funding, which could be a tough political lift in the current fiscal environment. This effort was not without its skeptics, as this well-commented Chronicle piece on the influence of Gates funds details.

7. The FAFSA changes to recognize same-sex parents, but is still complicated. Despite the push among many of the RADD grantees and at least some interest in Congress, the FAFSA ends 2013 as perhaps being more complicated than it was at the beginning of the year. This is because the venerable form changed to recognize the existence of same-sex marriages after this year’s Supreme Court ruling and political pressure before the ruling took place. The net result is that some students will see less aid. I would also be remiss if I didn’t mention my work with NASFAA on the feasibility of using prior prior year financial data to determine aid eligibility. That might get tied into the next HEA authorization.

6. Congress reached a reasonable solution on student loan interest rates. Put your shocked face on, folks—Congress did accomplish something without causing too much pain to students or financial aid offices. Interest rates on undergraduate subsidized Stafford loans were set to increase from 3.4% to 6.8% on July 1 (and actually did for a few weeks), leading to the hashtag #DontDoubleMyRate. The rates ended up being tied to 10-year Treasury notes, yielding a rate of under 4% this year; however, advocates note that the rate is likely to rise over time. Thankfully, Senator Warren’s plan to set interest rates based on the Federal Reserve discount window (which is nearly riskless) never received serious discussion.

5. MOOCs expand, but their outcomes are questioned. Massive open online courses (MOOCs) are seen by some as having the potential to change how higher education is delivered, but it is safe to say that not all faculty support them—as evidenced at San Jose State. MOOCs have also been hammered for low completion rates, which are often below 10%. The always-astute Kevin Carey notes, however, that the low completion rates are partially due to people who sign up for the course but never really attempt to complete them. Additionally, large numbers of students may still be completing the course, even if completion rates are low. This issue will only get hotter during 2014.

4. Student loan debt grows amid possible reforms. The Institute for College Access and Success (TICAS) recently put out its annual report on student debt loads—and the results aren’t pretty. The average debt load of graduates was $29,400 in 2012, and 71% of students took out debt. (Even more concerning is the fact that TICAS can’t even get data on a lot of colleges’ graduates.) Increasing debt loads have led to innovative plans to make college more affordable. The most-discussed plan is Oregon’s Pay it Forward proposal, which would be a type of income-based repayment covering tuition and fees in that state. While I have serious concerns about whether the program could work (but think it’s worth a demonstration program), my dear friend and dissertation mentor Sara Goldrick-Rab makes her opposition clear.

3. One of the nation’s more prominent community colleges might actually lose its accreditation. The City College of San Francisco is currently slated to lose its accreditation next summer if they do not meet 357 goals set by the Accrediting Commission for Junior and Community Colleges. Since students cannot qualify for federal Title IV financial aid if they attend an unaccredited college, this would effectively shut down an institution that had nearly 100,000 students. Students and faculty went after the accreditor and nearly shut it down, although it was recently announced that the accreditor could operate for another year. I still think that CCSF will keep its accreditation, but the damage (in terms of enrollment) may already be done.

2. Gainful employment continues to be a hot political topic. The Obama Administration proposed gainful employment regulations several years ago, in which vocationally-oriented colleges would lose Title IV eligibility if they had poor employment and loan repayment outcomes. These rules have been in and out of court for several years, and a new set is now being developed. The Department of Education tried to reach consensus with stakeholders last week, but failed; this means that ED will write its own rules. For all the developments that will happen in 2014, I’ll defer you to Ben Miller’s great work covering the topic.

1. PIRS roars to the public’s attention, and colleges are not happy. As regular readers of this blog know, I’m the methodologist for Washington Monthly’s annual college rankings. Yet I was completely floored when President Obama announced the impending development of a college ratings system for the 2014-15 academic year. (The official title—Postsecondary Institution Rating System or PIRS—just got released yesterday.) Thankfully, I was able to recover quickly enough to go on MSNBC the next night to talk about the proposal.

The Department of Education has done a lot of listening on the college ratings proposal, and the vast majority of the feedback in the higher education community appears to be negative. A recently released poll of college presidents highlights the opposition amid concerns of the ratings favoring highly selective institutions. (Yet the only measure that a majority of college presidents supported using was graduation rates—a measure strongly tied to selectivity.) This recent conference panel also shows some of the issues facing the ratings.

While the long-term goal is to tie ratings to financial aid by 2018 or so, I don’t see this as being likely to happen given its requirement of Congressional approval. However, the ratings could potentially help students even if institutions don’t like the bright lights of accountability. Let’s just say that the discussion around the release of the first ratings this summer should be spicy.

I’ll post a not-top-ten list of higher education policy issues later this week. Send me your suggestions for that piece, and let me know what you think of this list!
Don’t Dismiss Performance Based Funding Research

Performance-based funding (PBF), in which at least a small portion of state higher education appropriations are tied to outcomes, is a hot political topic in many states. According to the National Conference of State Legislatures and work by Janice Friedel and others, 22 states have PBF in place, seven more are transitioning to PBF, and ten more have discussed a switch.

The theory of PBF is simple: if colleges are incentivized to focus on improving student retention and graduation rates, they will redirect effort and funds from other areas to do so. PBF should work if two conditions hold:

(1) Colleges must currently be using their resources in ways that do not strongly correlate with student success, a point of contention with many institutions. If colleges are already operating in a way that maximizes student success, then PBF will not have an impact. PBF could also have negative effects if colleges end up using resources less effectively than they currently are.

(2) The expected funding tied to performance must be larger than the expected cost of changing institutional practices. Most state PBF systems currently tie small amounts of state appropriations to outcomes, which could result in the cost of making changes smaller than the benefits. Colleges also need to be convinced that PBF systems will be around for the long run instead of until the next governor ends the plan or state budget crises cut any funds for PBF. Otherwise, they may choose to wait out the current PBF system and not make any changes. Research by Kevin Dougherty and colleagues through the Community College Research Center highlights the unstable nature of many PBF systems.

For these reasons, the expected impacts of state PBF plans on student outcomes may not be positive. A recent WISCAPE policy brief by David Tandberg, an assistant professor at Florida State University, and Nicholas Hillman, an assistant professor at the University of Wisconsin-Madison, examines whether PBF plans appear to affect the number of associate’s and bachelor’s degrees awarded by institutions in affected states. Their primary findings are that although some states had significantly significant gains in degrees awarded (four at the four-year level and four at the two-year level), other states had significant declines (four at the four-year level and five at the two-year level). Moreover, PBF was most effective in inducing additional degree completions in states with long-running programs.

The general consensus in the research community is that more work needs to be done to understand the effects of state performance-based funding policies on student outcomes. PBF policies differ considerably by state, and it is too early to evaluate the impact of policies on states that have recently adopted the systems.

For these reasons, I was particularly excited to read the Inside Higher Ed piece by Nancy Shulock and Martha Snyder entitled, “Don’t Dismiss Performance Funding,” in response to Tandberg and Hillman’s policy brief. Shulock and Snyder are well-known individuals in the policy community and work for groups with significant PBF experience. However, their one-sided look at the research and cavalier assumptions about the authors’ motives upset me to the point that writing this response became necessary.

First of all, ad hominem attacks about the motives of well-respected researchers should never be a part of a published piece, regardless of the audience. Shulock and Snyder’s reference to the authors’ “surprising lack of curiosity about their own findings” is both an unfair personal attack and untrue. Tandberg and Hillman not only talk about the eight states with some positive impacts, they also discuss the nine states with negative impacts and a larger number of states with no statistically significant effects. Yet Shulock and Snyder do not bother mentioning the states with negative effects in their piece.

Shulock and Snyder are quite willing to attack Tandberg and Hillman for a perceived lack of complexity in their statistical model, particularly regarding their lack of controls for “realism and complexities.” In the academic community, criticisms like this are usually followed up with suggestions on how to improve the model given available data. Yet they fail to do so.

It is also unusual to see a short policy brief like this receive such a great degree of criticism, particularly when the findings are null, the methodology is not under serious question, and the authors are assistant professors. As a new assistant professor myself, I hope that this sort of criticism does not deter untenured faculty and graduate students from pursuing research in policy-relevant fields.

I teach higher education finance to graduate students, and one of the topics this semester was performance-based funding and accountability policy. If Shulock and Snyder submitted their essay for my class, I would ask for a series of revisions before the end of the semester. They need to provide empirical evidence in support of their position and to accurately describe the work done by Tandberg and Hillman. They deserve to have their research fairly characterized in the public sphere.

Performance Indicators and College Ratings

This has been a busy part of the semester from both the teaching and research sides of work. But I was able to go to part of the Association for the Study of Higher Education (ASHE) conference, which included a great panel discussion on performance indicators and college ratings. Rather than write a typical blog post, I’m giving Storify a shot. Below is the link to my story:

http://storify.com/rkelchen/performance-indicators-and-college-ratings#

Take a look and let me know what you think!

Let’s Track First-Generation Students’ Outcomes

I’ve recently written about the need to report the outcomes of students based on whether they received a Pell Grant during their first year of college. Given that annual spending on the Pell Grant is about $35 billion, this should be a no-brainer—especially since colleges are already required to collect the data under the Higher Education Opportunity Act. Household income is a strong predictor of educational attainment, so people interested in social mobility should support publishing Pell graduation rates. I’m grateful to get support from Ben Miller of the New America Foundation on this point.

Yet, there has not been a corresponding call to collect information based on parental education, even though there are federal programs targeted to supporting first-generation students. The federal government already collects parental education on the FAFSA, although the choice of “college or beyond” may be unclear. (It would be simple enough to clarify the question if desired.)

My proposal here is simple: track graduation rates by parental education. It can be easily done through the current version of IPEDS, although the usual caveats about IPEDS’s focus on first-time, full-time students still applies. This could be another useful data point for students and their families, as well as policymakers and potentially President Obama’s proposed college ratings. Collecting these data shouldn’t be an enormous burden on institutions, particularly in relationship to their Title IV funds received.

Let’s continue to work to improve IPEDS by collecting more useful data, and this should be a part of the conversation.

The Value of “Best Value” Lists

I can always tell when a piece about college rankings makes an appearance in the general media. College administrators see the piece and tend to panic while reaching out to their institutional research and/or enrollment management staffs. The question asked is typically the same: why don’t we look better in this set of college rankings? As the methodologist for Washington Monthly magazine’s rankings, I get a flurry of e-mails from these panicked analysts trying to get answers for their leaders—as well as from local journalists asking questions about their hometown institution.

The most recent article to generate a burst of questions to me was on the front page of Monday’s New York Times.  It noted the rise in lists that look at colleges’ value to students instead of the overall performance on a broader set of criteria. (A list of the top ten value colleges across numerous criteria can be found here.) While Washington Monthly’s bang-for-the-buck article from 2012 was not the first effort at looking at a value list (Princeton Review has that honor, to the best of my knowledge), we were the first to incorporate a cost-adjusted performance measure that accounts for student characteristics and the net price of attendance.

When I talk with institutional researchers or journalists, my answer is straightforward. To look better on a bang-for-the-buck list, colleges have to either increase their bang (higher graduation rates and lower default rates, for example) or lower their buck (with a lower net price of attendance). Prioritizing these measures does come with concerns (see Daniel Luzer’s Washington Monthly piece), but the good most likely outweighs the bad.

Moving forward, it will be interesting to see how these lists continue to develop, and whether they are influenced by the Obama Administration’s proposed college ratings. It’s an interesting time in the world of college rankings, ratings, and guides.

Two and a Half Cheers for Prior Prior Year!

Earlier this week, the National Association of Student Financial Aid Administrators (NASFAA) released a report I wrote with Gigi Jones of NASFAA on the potential to use prior prior year income data (PPY) in determining students’ financial aid awards. Compared to the current policy of prior year (PY) data, students could file the FAFSA up to a year earlier than under current law. (See this previous post for a more detailed summary of PPY.)

Although the use of PPY could advance the timeline for financial aid notification, this could also have the effect of changing some students’ aid packages. For example, if a dependent student’s family had a large decrease in family income the year before entering college, the financial aid award would be more generous under PY. Other students’ aid packages would be more generous under PPY. Although we might expect that the number of aid increases and decreases from a move to PPY would balance each other out, the existence of professional judgments (in which financial aid officers can adjust students’ aid packages based on unusual circumstances) complicates that analysis. As a result, it’s possible that PPY could increase program costs in addition to the burden faced by financial aid offices.

To examine the feasibility and potential distributional effects of PPY, we received student-level FAFSA data from nine colleges and universities from the 2007-08 through the 2012-13 academic years. We then estimated the expected family contribution (EFC) for students using PY and PPY data to see how much Pell Grant awards would vary by the year of financial data used. (This exercise also gave me a much greater appreciation for how complicated it truly is to calculate the EFC…and how much data is currently needed in the FAFSA!)

The primary result of the study is that about two-thirds of students would see the exact same Pell award using PPY as they would using PY. These students tend to fall into two groups—students who would never be eligible for the Pell (and are largely filing the FAFSA to be eligible for federal student loans) and those with zero EFC. Students near the Pell eligibility threshold are the bigger concern, as about one in seven students would see a change in their Pell award of at least $1,000 under PPY compared to PY. However, many of these students would never know their PY eligibility, somewhat reducing concerns about the fairness of the change.

To me, the benefits of PPY are pretty clear. So why two and a half cheers? I have three reasons to knock half a cheer off my assessment of a program that is still quite promising:

(1) We don’t know much about the burden of PPY on financial aid offices. When I’ve presented earlier versions of this work to financial aid administrators, they generally think that the additional burden of professional judgments (students appealing their aid awards due to extenuating circumstances) won’t be too bad. I hope they’re right, but it is worth a note of caution going forward.

(2) If students request professional judgments and are successful in getting a larger Pell award, program costs will increase. Roughly 5-7% of students would see their Pell fall by $1,000 or more under PPY. If about 2% of the Pell population is successful (200,000 students), program costs could rise by something like $300-$500 million per year. Compared to a $34 billion program budget, that’s noticeable, but not enormous.

(3) A perfectly implemented PPY program would let students know their eligibility for certain types of financial aid a year earlier than current rules, so as early as the spring of a traditional-age student’s junior year of high school. While that is an improvement, it may still not be early enough to sufficiently influence students’ academic and financial preparation for college. Early commitment and college promise programs reach students at earlier ages, and thus have more potential to be successful.

Even after noting these caveats, I would like to see PPY get a shot at a demonstration program in the next few years. If it can help at least some students at a reasonable cost, let’s give it a try and see if it does induce students to enroll and persist in college.

Free the Pell Graduation Data!

Today is an exciting data in my little corner of academia, as the end of the partial government shutdown means that federal education datasets are once again available for researchers to use. But the most exciting data to come out today is from Bob Morse, rankings guru for U.S. News and World Report. He has collected graduation rates for Pell Grant recipients, long an unknown for the majority of colleges. Despite the nearly $35 billion per year we spend on the Pell program, we have no idea what the national graduation rate is for Pell recipients. (Richard Vedder, economist of higher education at Ohio University, has mentioned a ballpark estimate of 30%-40% in many public appearances, but he notes that is just a guess.)

Morse notes in his blog post that colleges have been required to collect and disclose graduation rates for Pell recipients since the 2009 renewal of the Higher Education Act. I’ve heard rumors of this for years, but these data have not yet made their way into IPEDS. I have absolutely no problems with him using the data he collects in the proprietary U.S. News rankings, nor do I object to him holding the data very tight—after all, U.S. News did spend time and money collecting it.

However, given that the federal government requires that Pell graduation rates be collected, the Department of Education should collect this data and make it freely and publicly available as soon as possible. This would also be a good place for foundations to step in and help collect this data in the meantime, as it is certainly a potential metric for the President’s proposed college ratings.

Update: An earlier version of this post stated that the Pell graduation data are a part of the Common Data Set. Bob Morse tweeted me to note that they are not a part of that set and are collected by U.S. News. My apologies for the initial error! He also agreed that NCES should collect the data, which only understates the importance of this collection.

State Need and Merit Aid Spending

I’m fortunate to be teaching a class in higher education finance this semester, as it’s a class that I greatly enjoy and is also intertwined with my research interests. I’m working on slides for a lecture on grant aid (both need-based and merit-based) in the next few weeks, which involves creating graphics about trends in aid. In this post, I’m sharing two of my graphics about state-level financial aid.

States have taken different philosophies regarding financial aid. Some states, particularly in the South, have focused more of their resources on merit-based aid, rewarding students with strong pre-college levels of academic achievement. Other states have put their resources into need-based aid, such as Wisconsin and New Jersey. Yet others have chosen to keep the cost of college low instead of providing aid to students.

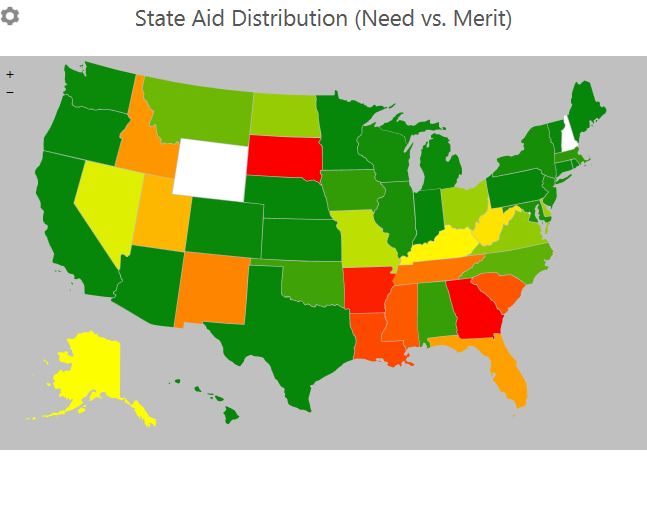
The two charts below demonstrate the states’ differences in philosophies. The state-level data come from the National Association of State Student Aid & Grant Programs (NASSGAP) from the 2011-12 academic year. The first chart shows the percentage of funds given to need-based aid (green) and merit-based aid:

state_aid_distribution

Two states currently have no need-based aid (Georgia and South Dakota), and six other states allocate 75% or more of state aid to merit-based programs. On the other hand, nine states only have need-based aid programs and 16 more allocate 90% or more to need-based aid. Two states (New Hampshire and Wyoming) did not report having student aid programs in 2011-12.

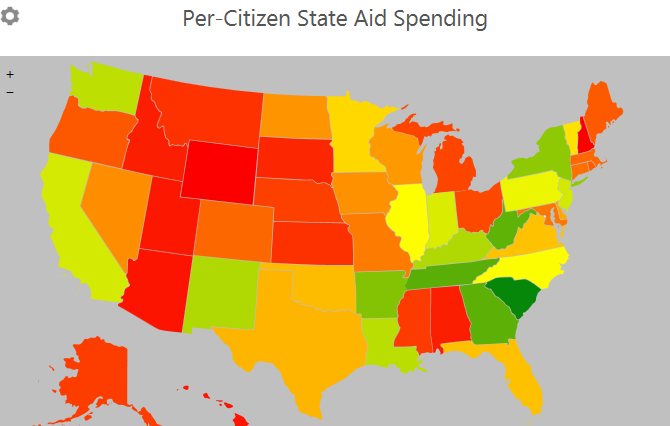
The second chart measures the intensity of spending on state-level student aid. I divide overall spending by the state’s population in 2012, as estimated by the Census Bureau. States with more spending on aid per student are in green, while lower-spending states are in red:

state_aid_spending

South Carolina leads the way in state student aid, with nearly $69 per resident; four other Southern states provide $50 or more per resident. The other extreme sees 15 states spending less than $10 per person on aid.

Notably, states with more of an emphasis on merit aid spend more on per-resident aid. The correlation between the percentage of funds allocated to need-based aid and per-resident spending is -0.33, suggesting that merit-based programs (regardless of their effectiveness) are more capable of generating resources for students.

I’m looking forward to using these graphics (and several others) in my class on grant aid, as the class has been so much fun this semester. I hope my students feel the same way!

What Should Be in the President’s College Ratings?

President Obama’s August announcement that his administration would work to develop a college rating system by 2015 has been the topic of a great deal of discussion in the higher education community. While some prominent voices have spoken out against the ratings system (including my former dissertation advisor at Wisconsin, Sara Goldrick-Rab), the Administration appears to have redoubled its efforts to create a rating system during the next eighteen months. (Of course, that assumes the federal government’s partial shutdown is over by then!)

As the ratings system is being developed, Secretary Duncan and his staff must make a number of important decisions:

(1) Do they push for ratings to be tied to federal financial aid (requiring Congressional authorization), or should they just be made available to the public as one of many information sources?

(2) Should they be designed to highlight the highest-performing colleges, or should they call out the lowest-performing institutions?

(3) Should public, private nonprofit, and for-profit colleges be held to separate standards?

(4) Should community colleges be included in the ratings?

(5) Will outcome measures be adjusted for student characteristics (similar to the value-added models often used in K-12 education)?

After these decisions have been made, then the Department of Education can focus on selecting possible outcomes. Graduation rates and student loan default rates are likely to be a part of the college ratings, but what other measures could be considered—both now and in the future? An expanded version of gainful employment, which is currently used for vocationally-oriented programs, is certainly a possibility, as is some measure of earnings. These measures may be subject to additional legal challenges. Some measure of cost may also make its way into the ratings, rewarding colleges that operate in a more efficient manner.

I would like to hear your thoughts (in the comments section below) about whether these ratings are a good idea and what measures should be included. And when the Department of Education starts accepting comments on the ratings, likely sometime in 2014, I encourage you to submit your thoughts directly to them!