One of the most-discussed higher education policy proposals from President Donald Trump has been a proposal to tax the endowments of wealthy colleges that are seen as not using enough money on financial aid. Key Trump supporter Rep. Tom Reed (R-NY) has introduced legislation requiring colleges with endowments over $1 billion to spend at least 25% of all investment returns on financial aid, much to the chagrin of wealthy colleges.
This proposal does not take into account the size of a college—which means that colleges with similar endowment levels can have vastly different levels of resources. For example, Vassar College and North Carolina State University had endowments just under $1 billion as of June 2015, but the sizes of the institutions are far different. Vassar has about 2,500 undergraduate students, while NC State has nearly ten times as many.
Another important factor is the financial need of students. Colleges can have similar sizes and similar endowment levels, but differ substantially in their number of Pell recipients (a proxy for low-income status). Washington State University and the University of Missouri-Columbia both have endowments around $900 million, but Washington State enrolled 3,000 more Pell recipients than Mizzou in spite of enrolling 4,000 fewer undergraduates. This means that Mizzou has the ability to target more aid to their Pell recipients should they choose to do so.
To explore this point in more detail (and thanks to Sara Goldrick-Rab for the idea), I dove into newly available finance data from the Integrated Postsecondary Education Data System (IPEDS) for the 2014-15 academic year and merged it with data on the number of Pell recipients for the same year from Federal Student Aid’s Title IV volume report datasets. After eliminating colleges that did not report endowment values or reported endowment or Pell recipient data in conjunction with other campuses, my sample consisted of 479 public four-year colleges and 909 private nonprofit colleges. You can download the spreadsheet here to see the ratios for each college with data. (Note: This was updated on February 20 to include colleges in the District of Columbia. Thanks to Patricia McGuire for calling that error to my attention!)
Most colleges have quite small endowments per Pell recipient, as shown in the graph below. The median public college had an endowment of $12,778 per Pell recipient in 2014-15, while the median private college had an endowment of $65,295. Given typical endowment spending rates of about 5% per year, this means that public colleges can spend about $640 per Pell recipient on financial aid and private colleges could spend about $3,200 per recipient. But this assumes that (1) colleges will only spend their endowment proceeds on need-based aid and (2) colleges can actually use their endowments on whatever they want instead of what donors say. This means that most colleges do not have much ability to significantly improve financial aid packages based on endowment proceeds alone.
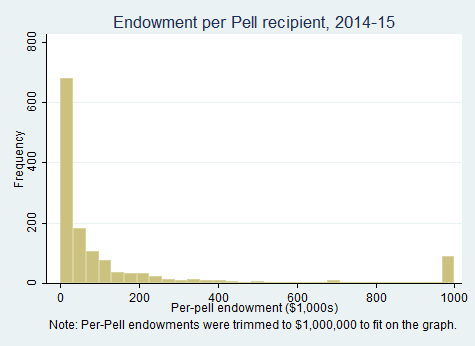
The other thing that stands out in the graph is the number of colleges with endowments of over $1 million per Pell recipient. In 2014-15, 92 colleges were in the millionaires’ club, including 88 private nonprofit colleges and four public colleges (William and Mary, Michigan, Virginia, and Virginia Military Institute—an unusual institution). Below are the institutions with the 25 highest endowment to Pell ratios. All of these colleges have more than $4.2 million per Pell recipient—an enviable position should any of these colleges seek to increase low-income student enrollment.
| Name | Undergrad enrollment | Pell enrollment | Endowment ($bil) | Endowment per Pell recipient ($mil) |
| Johns Hopkins University | 6357 | 787 | 3.33 | 4.23 |
| Grinnell College | 1734 | 393 | 1.79 | 4.55 |
| Claremont McKenna College | 1301 | 152 | 0.73 | 4.83 |
| Amherst College | 1792 | 442 | 2.19 | 4.96 |
| Bowdoin College | 1805 | 278 | 1.39 | 5.01 |
| Columbia University in the City of New York | 8100 | 1912 | 9.64 | 5.04 |
| Williams College | 2072 | 403 | 2.27 | 5.62 |
| Northwestern University | 9048 | 1256 | 7.59 | 6.04 |
| University of Pennsylvania | 11548 | 1643 | 10.10 | 6.17 |
| Pomona College | 1650 | 326 | 2.10 | 6.44 |
| Swarthmore College | 1542 | 237 | 1.85 | 7.79 |
| Dartmouth College | 4289 | 596 | 4.66 | 7.82 |
| Duke University | 6626 | 925 | 7.30 | 7.89 |
| Washington and Lee University | 1890 | 181 | 1.47 | 8.13 |
| Rice University | 3926 | 620 | 5.57 | 8.99 |
| University of Notre Dame | 8448 | 902 | 8.78 | 9.74 |
| Soka University of America | 411 | 123 | 1.22 | 9.93 |
| University of Chicago | 5738 | 639 | 6.55 | 10.30 |
| Washington University in St Louis | 7401 | 571 | 6.89 | 12.10 |
| California Institute of Technology | 983 | 127 | 2.08 | 16.40 |
| Massachusetts Institute of Technology | 4512 | 806 | 13.50 | 16.70 |
| Stanford University | 7019 | 1106 | 22.20 | 20.10 |
| Princeton University | 5391 | 790 | 22.30 | 28.20 |
| Harvard University | 10338 | 1238 | 37.60 | 30.40 |
| Yale University | 5477 | 724 | 25.50 | 35.30 |