Options for Replacing Standardized Test Scores for Researchers and Rankers

It’s the second Monday in September, so it’s time for the annual college rankings season to conclude with U.S. News & World Report’s entry. The top institutions in the rankings change little from year to year, but colleges pay lots of attention to statistically insignificant movements. Plenty has been written on those points, and plenty of digital ink has also been spilled on U.S. News’s decision to keep standardized test scores in their rankings this year.

In this blog post, I want to look a few years farther down the line. Colleges were already starting to adopt test-optional policies prior to March 2020, but the pandemic accelerated that trend. Now a sizable share of four-year colleges had taken a hiatus from requiring ACT or SAT scores, and many may not go back. This means that people who have used test scores in their work—whether as academic researchers or college rankings methodologists—will have to think about how to proceed going forward.

The best metrics to replace test scores depend in part on the goals of the work. Most academic researchers use test scores as a control variable in regression models as a proxy for selectivity or as a way to understand the incoming academic performance of students. High school GPA is an appealing measure, but is not available in the Integrated Postsecondary Education Data System and also varies considerably across high schools. Admit rates and yield rates are available in IPEDS and capture some aspects of selectivity and student preferences to attend particular colleges. Admit rates can be gamed by trying to get as many students as possible with no interest in the college to apply and be rejected, and yield rates vary considerably based on the number of colleges students apply to.

Other potential metrics are likely not nuanced enough to capture smaller variations across colleges. Barron’s Profiles of American Colleges has a helpful admission competitiveness rating (and as a plus, that thick book held up my laptop for hundreds of hours of Zoom calls during the pandemic). But there are not that many categories and they change relatively little over time. Carnegie classifications focus more on the research side of things (a key goal for some colleges), but again are not as nuanced and are only updated every few years.

If the goal is to get at institutional prestige, then U.S. News’s reputational survey could be a useful resource. The challenge there is that colleges have a history of either not caring about filling out the survey or trying to strategically game the results by ranking themselves far higher than their competitors. But if a researcher wants to get at prestige and is willing to compile a dataset of peer assessment scores over time, it’s not a bad idea to consider.

Finally, controlling for socioeconomic and racial/ethnic diversity are also options given the correlations between test scores and these factors. I was more skeptical of these correlations until moving to New Jersey and seeing all of the standardized test tutors and independent college counselors that existed in one of the wealthiest parts of the country.

As the longtime data editor for the Washington Monthly rankings, it’s time for me to start thinking about changes to the 2022 rankings. The 2021 rankings continued to use test scores as a control for predicting student outcomes and I already used admit rates and demographic data from IPEDS as controls. Any suggestions that people have for publicly-available data to replace test scores in the regressions would be greatly appreciated.

Comments on the CollegeNET-PayScale Social Mobility Index

The last two years have seen a great deal of attention being placed on the social mobility function that many people expect colleges to perform. Are colleges giving students from lower-income families the tools and skills they need in order to do well (and good) in society? The Washington Monthly college rankings (which I calculate) were the first entrant in this field nearly a decade ago, and we also put out lists of the Best Bang for the Buck and Affordable Elite colleges in this year’s issue. The New York Times put out a social mobility ranking in September, which essentially was a more elite version of our Affordable Elite list, which looked at only about 100 colleges with a 75% four-year graduation rate.

The newest entity in the cottage industry of social mobility rankings comes from PayScale and CollegeNET, an information technology and scholarship provider. Their Social Mobility Index (SMI) includes five components for 539 four-year colleges, with the following weights:

Tuition (lower is better): 126 points

Economic background (percent of students with family incomes below $48,000): 125 points

Graduation rate (apparently six years): 66 points

Early career salary (from PayScale data): 65 points

Endowment (lower is better): 30 points

The top five colleges in the rankings are Montana Tech, Rowan , Florida A&M, Cal Poly-Ponoma, and Cal State-Northridge, while the bottom five are Oberlin, Colby, Berklee College of music, Washington University, and the Culinary Institute of America.

Many people will critique the use of PayScale’s data in rankings, and I would partially agree—although it’s the best data that is available nationwide at this point until the ban on unit record data is eliminated. My two main critiques of these rankings are the following:

Tuition isn’t the best measure of college affordability. Judging by the numbers used in the rankings, it’s clear that the SMI uses posted tuition and fees for affordability. This doesn’t necessarily reflect what the typical lower-income student would actually pay for two reasons, as it excludes room, board, and other necessary expenses while also excluding any grant aid. The net price of attendance (the total cost of attendance less all grant aid) is a far better measure of what students from lower-income families may pay, even though the SMI measure does capture sticker shock.

The weights are justified, but still arbitrary. The SMI methodology includes the following howler of a sentence:

“Unlike the popular periodicals, we did not arbitrarily assign a percentage weight to the five variables in the SMI formula and add those values together to obtain a score.”

Not to put my philosopher hat on too tightly, but any weights given in college rankings are arbitrarily assigned. A good set of rankings is fairly insensitive to changes in the weighting methodology, while the SMI does not answer that question.

I’m pleased to welcome another college rankings website to this increasingly fascinating mix of providers—and I remain curious the extent to which these rankings (along with many others) will be used as either an accountability or a consumer information tool.

Are “Affordable Elite” Colleges Growing in Size, or Just Selectivity?

A new addition to this year’s Washington Monthly college guide is a ranking of “Affordable Elite” colleges. Given that many students and families (rightly or wrongly) focus on trying to get into the most selective colleges, we decided to create a special set of rankings covering only the 224 most highly-competitive colleges in the country (as defined by Barron’s). Colleges are assigned scores based on student loan default rates, graduation rates, graduation rate performance, the percentage of students receiving Pell Grants, and the net price of attendance. UCLA, Harvard, and Williams made the top three, with four University of California campuses in the top ten.

I received an interesting piece of criticism regarding the list by Sara Goldrick-Rab, professor at the University of Wisconsin-Madison (and my dissertation chair in graduate school). Her critique noted that the size of the school and the type of admissions standards are missing from the rankings. She wrote:

“Many schools are so tiny that they educate a teensy-weensy fraction of American undergraduates. So they accept 10 poor kids a year, and that’s 10% of their enrollment. Or maybe even 20%? So what? Why is that something we need to laud at the policy level?”

While I don’t think that the size of the college should be a part of the rankings, it’s certainly worth highlighting the selective colleges that have expanded over time compared to those which have remained at the same size in spite of an ever-growing applicant pool.

I used undergraduate enrollment data from the fall semesters of 1980, 1990, 2000, and 2012 from IPEDS for both the 224 colleges in the Affordable Elite list and 2,193 public and private nonprofit four-year colleges not on the list. I calculated the percentage change between each year and 2012 for the selective colleges on the Affordable Elite list and the other less-selective colleges to get an idea of whether selective colleges are curtailing enrollment.

[UPDATE: The fall enrollment numbers include all undergraduates, including nondegree-seeking institutions. This doesn’t have a big impact on most colleges, but does at Harvard–where about 30% of total undergraduate enrollment is not seeking a degree. This means that enrollment growth may be overstated. Thanks to Ben Wildavsky for leading me to investigate this point.]

The median Affordable Elite college enrolled 3,354 students in 2012, compared to 1,794 students at the median less-selective college. The percentage change at the median college between each year and 2012 is below:

Period Affordable Elite Less selective
2000-2012 10.9% 18.3%
1990-2012 16.0% 26.3%
1980-2012 19.9% 41.7%


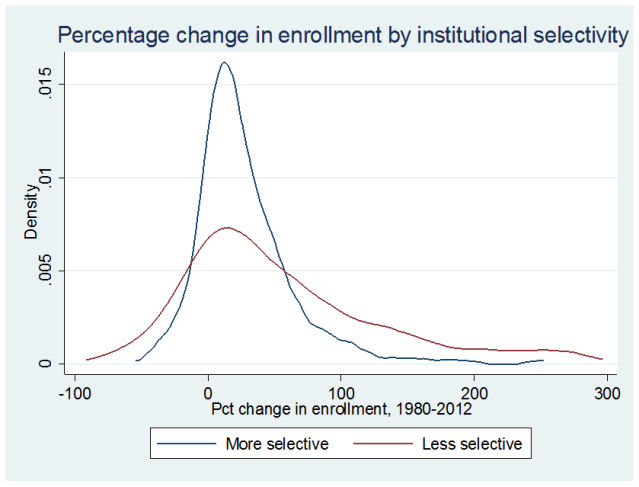
The distribution of growth rates is shown below:

enrollment_by_elite

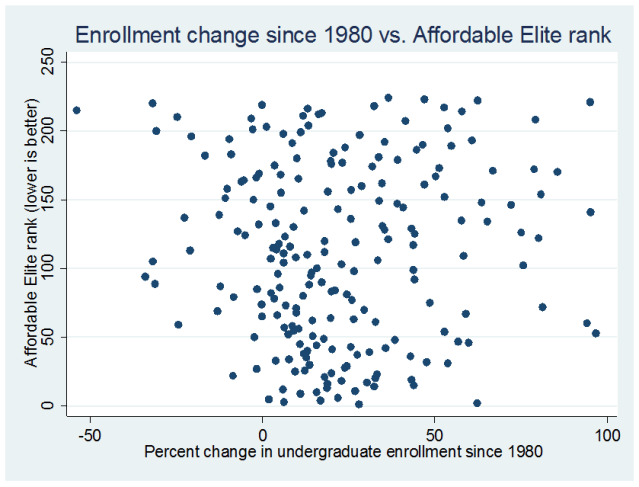
So, as a whole, less-selective colleges are growing at a more rapid pace than the ones on the Affordable Elite list. But do higher-ranked elite colleges grow faster? The scatterplot below suggests not really—with a correlation of -0.081 between rank and growth, suggesting that higher-ranked colleges grow at slightly slower rates than lower-ranked colleges.

enrollment_vs_rank

But some elite colleges have grown. The top ten colleges in the Affordable Elite list have the following growth rates:

      Change from year to 2012 (pct)
Rank Name (* means public) 2012 enrollment 2000 1990 1980
1 University of California–Los Angeles (CA)* 27941 11.7 15.5 28.0
2 Harvard University (MA) 10564 6.9 1.7 62.3
3 Williams College (MA) 2070 2.5 3.2 6.3
4 Dartmouth College (NH) 4193 3.4 11.1 16.8
5 Vassar College (NY) 2406 0.3 -1.8 1.9
6 University of California–Berkeley (CA)* 25774 13.7 20.1 21.9
7 University of California–Irvine (CA)* 22216 36.9 64.6 191.6
8 University of California–San Diego (CA)* 22676 37.5 57.9 152.5
9 Hanover College (IN) 1123 -1.7 4.5 11.0
10 Amherst College (MA) 1817 7.2 13.7 15.8


Some elite colleges have not grown since 1980, including the University of Pennsylvania, MIT, Boston College, and the University of Minnesota. Public colleges have generally grown slightly faster than private colleges (the UC colleges are a prime example), but there is substantial variation in their growth.

The College Ratings Suggestion Box is Open

The U.S. Department of Education is hard at work developing a Postsecondary Institution Ratings System (PIRS), that will rate colleges before the start of the 2015-16 academic year. In addition to a four-city listening tour in November 2013, ED is seeking public comments and technical expertise to help guide them through the process. The full details about what ED is seeking can be found on the Federal Register’s website, but the key questions for the public are the following:

(1) What types of measures should be used to rate colleges’ performance on access, affordability, and student outcomes? ED notes that they are interested in measures that are currently available, as well as ones that could be developed with additional data.

(2) How should all of the data be reduced into a set of ratings? This gets into concerns about what statistical weights should be assigned to each measure, as well as whether an institution’s score should be adjusted to account for the characteristics of its students. The issue of “risk adjusting” is a hot topic, as it helps broad-access institutions perform well on the ratings, but has also been accused of resulting in low standards in the K-12 world.

(3) What is the appropriate set of institutional comparisons? Should there be different metrics for community colleges versus research universities? And how should the data be displayed to students and policymakers?

The Department of Education has convened a technical panel on January 22 to grapple with these questions, and I will be among the presenters at that symposium. I would appreciate your thoughts on these questions (as well as the utility of federal college ratings in general), either in the comments section of this blog or via e-mail. I also encourage readers to submit their comments to regulations.gov by January 31.

More on Rate My Professors and the Worst Universities List

It turns out that writing on the issue of whether Rate My Professors should be used to rank colleges is a popular topic. My previous blog post on the topic, in which I discuss why the website shouldn’t be used as a measure of teaching quality, was by far the most-viewed post that I’ve ever written and got picked up by other media outlets. I’m briefly returning to the topic to acknowledge a wonderful (albeit late) statement released by the Center for College Affordability and Productivity, the data source which compiled the Rate My Professors (RMP) data for Forbes.

The CCAP’s statement notes that the RMP data should only be considered as a measure of student satisfaction and not a measure of teaching quality. This is a much more reasonable interpretation, given the documented correlation between official course evaluations and RMP data—it’s also no secret that certain disciplines receive lower student evaluations regardless of teaching quality. The previous CBS MoneyWatch list should be interpreted as a list of schools with the least satisfied students before controlling for academic rigor or major fields, but that doesn’t make for as spicy of a headline.

Kudos to the CCAP for calling out CBS regarding its misinterpretation of the RMP data. Although I think that it is useful for colleges to document student satisfaction, this measure should not be interpreted as a measure of instructional quality—let alone student learning.

Using Input-Adjusted Measures to Estimate College Performance

I have been privileged to work with HCM Strategists over the past two years on a Gates Foundation-funded project to explore how to use input-adjusted measures to estimate a college’s performance. Although the terminology sounds fancy, the basic goal of the project is to figure out better ways to measure whether a college does a good job educating the types of students that it actually enrolls. It doesn’t make any sense to measure a highly selective and well-resourced flagship university against an open-access commuter college; doing so is akin to comparing my ability to run a marathon with that of an elite professional athlete. Just like me finishing a marathon is a much more substantial accomplishment, getting a first-generation student with modest academic preparation to graduate is a much bigger deal than someone whom everyone expected to race through their coursework with ease.

The seven-paper project was officially unveiled in Washington on Friday, and I was able to make it out there for the release. My paper (joint work with Doug Harris) is essentially a policymaker’s version of our academic paper on the pitfalls of popular rankings. It’s worth a read if you want to find out more about my research beyond the Washington Monthly rankings.  Additional media coverage can be found in The Chronicle of Higher Education and Inside Higher Ed.

As a side note, it’s pretty neat that the Inside Higher Ed article links to the “authors” page of the project’s website (which includes my bio and information) under the term “prominent scholars.” I know I’m by no means a prominent scholar, but maybe some of that will rub off the others via association.