New Research on the Prevalence and Effects of Differential Tuition Policies

I am thrilled to share a new open-access article in AERA Open that I wrote on the topic of differential tuition policies at public universities. Differential tuition, in which students pay higher charges for fields of study that are more expensive to operate and/or are in high demand among students, have anecdotally become more popular in recent years. Yet the only published research on the effects of differential tuition (a great study that motivated my work) focused on public research universities that adopted differential tuition by the 2007-08 academic year.

I decided to slowly chip away at collecting data on the presence of differential tuition in business, engineering, and nursing programs between the 2003-04 and 2022-23 academic years. It took me more than three months to compile a dataset that you can download here, and then several additional months to do data checks and write the paper (with the help of a new research assistant who debuted during the project and alternated between sleeping and data entry).

Notably, nearly half of all public universities—and just over half of all research universities—adopted differential tuition by the 2022-23 academic year. While I did not have the resources to collect data on the amount of the differential (funders, reach out if you’re interested in supporting an extension of this work!), differentials ranged from a few dollars per credit hour to several thousand dollars per year.

I then examined whether the adoption of differential tuition increased the number of bachelor’s degrees awarded in business, engineering, or nursing. In general, there were no effects on business or nursing and some modest increases in the number of engineering degrees. However, any benefits of expanded access largely accrued to White students.

Check out the full article and let me know what you think. I am certainly open to extending this work, so any suggestions would be greatly appreciated.

Documenting the Growth of Responsibility Center Management Budget Models in Public Higher Education

As most of higher education is concerned about their financial position, a growing number of colleges are trying to encourage academic units to generate additional revenues and cut back on expenses. One popular way of doing this is through responsibility center management (RCM) budget models, which base a portion of a unit’s budget on their ability to effectively generate and use resources.[1]

Both universities that I have worked at (Seton Hall and Tennessee) have adopted variations of RCM budget models, and there is a lot of interest—primarily at research universities—in pursuing RCM. Having been through RCM, I am quite interested in the downstream implications of RCM on how leaders of institutions and units behave. There are a couple of good scholarly articles about the effects of RCM that I use when I teach higher education finance, but they are based on a small number of fairly early adopters and the findings are mixed.

One of my current research projects is examining the growth of master’s degree programs (see our recent policy brief), and I have a strong suspicion that institutions adopting RCM budget models are more likely to launch new programs as units try to gain additional revenue. My sense is that there have been a lot of recent adopters, but the best information out there about who has adopted RCM comes from slides or information provided by consulting firms (which often are not under contract by the time the model is supposed to be fully implemented). This led me to spot check a few institutions commonly listed on charts, and some of them appear to have either never gotten past the planning stage or quietly moved to another budget model.

My outstanding research assistant Faith Barrett and I went through documents from 535 public universities (documents from private colleges are rarely available) to collect information on whether they had announced a move to RCM, actually implemented it, and/or abandoned RCM to return to a centralized budget model.[2] The below figure summarizes the number of public universities that had active, implemented RCM budget models for each year between 1988 and 2023.[3]

There has been a clear and steady uptick in the number of public universities with active RCM models, reaching 68 by 2023. Most of this increase has happened since 2013, when just 25 universities used RCM. Only seven universities that fully implemented RCM fully abandoned the model based on publicly available documents (Central Michigan, Ohio, Texas Tech, Illinois-Chicago, Oregon, and South Dakota), although quite a few colleges have backed off how much money flows through RCM.

Additionally, a number of universities publicly announced plans to move to RCM before apparently abandoning them before implementation. Some examples include Missouri, Nebraska, and Wayne State. This is notable because these are often included on consultants’ slide decks as successful moves to RCM.

Here is the list of universities that had fully implemented RCM by fall 2023. If you see any omissions or errors, please let me know!

NameState
Auburn UniversityAL
University of Alabama at BirminghamAL
University of ArizonaAZ
University of California-DavisCA
University of California-Los AngelesCA
University of California-RiversideCA
University of Colorado BoulderCO
University of Colorado Denver/Anschutz Medical CampusCO
University of DelawareDE
University of Central FloridaFL
University of FloridaFL
Georgia Institute of Technology-Main CampusGA
Iowa State UniversityIA
University of IowaIA
Boise State UniversityID
Idaho State UniversityID
University of IdahoID
University of Illinois ChicagoIL
University of Illinois Urbana-ChampaignIL
Ball State UniversityIN
Indiana University-BloomingtonIN
Indiana University-Purdue University-IndianapolisIN
Kansas State UniversityKS
University of KansasKS
Northern Kentucky UniversityKY
Western Kentucky UniversityKY
University of BaltimoreMD
University of Michigan-Ann ArborMI
University of Michigan-DearbornMI
Western Michigan UniversityMI
University of Minnesota-Twin CitiesMN
University of Missouri-Kansas CityMO
The University of MontanaMT
North Dakota State University-Main CampusND
University of North DakotaND
University of New Hampshire-Main CampusNH
Rutgers University-CamdenNJ
Rutgers University-New BrunswickNJ
Rutgers University-NewarkNJ
University of New Mexico-Main CampusNM
Kent State University at KentOH
Miami University-HamiltonOH
Miami University-MiddletownOH
Miami University-OxfordOH
Ohio State University-Main CampusOH
University of Cincinnati-Main CampusOH
Oregon State UniversityOR
Southern Oregon UniversityOR
Pennsylvania State University-Main CampusPA
Temple UniversityPA
University of Pittsburgh-Pittsburgh CampusPA
College of CharlestonSC
University of South Carolina-ColumbiaSC
East Tennessee State UniversityTN
Tennessee Technological UniversityTN
The University of Tennessee-KnoxvilleTN
University of MemphisTN
The University of Texas at ArlingtonTX
The University of Texas at San AntonioTX
University of UtahUT
George Mason UniversityVA
University of Virginia-Main CampusVA
Virginia Commonwealth UniversityVA
University of VermontVT
Central Washington UniversityWA
University of Washington-Bothell CampusWA
University of Washington-Seattle CampusWA
University of Wisconsin-MadisonWI

[1] This is also called responsibility centered management, and I cannot for the life of me figure out which one is preferred. To-may-to, to-mah-to…

[2] RCM can be designed with various levels of centralization. Pay attention to the effective tax rates that units pay to central administration—they say a lot about the incentives given to units.

[3] This excludes so-called “shadow years” in which the model was used for planning purposes but the existing budget model was used to allocate resources.

Discovering Issues with IPEDS Completions Data

The U.S. Department of Education’s Integrated Postsecondary Education Data System (IPEDS) is a great resource in the field of higher education. While it is the foundation of much of my research, the data are self-reported by colleges and occasionally include errors or implausible values. A great example of some of the issues with IPEDS data is this recent Wall Street Journal analysis of the finances of flagship public universities. When their great reporting team started asking questions, colleges often said that their IPEDS submission was incorrect. That’s not good.

I received grants from Arnold Ventures over the summer to fund two new projects. One of them is examining the growth in master’s degree programs over time and the implications for students and taxpayers. (More on the other project sometime soon.) This led me to work with my sharp graduate research assistant Faith Barrett to dive into IPEDS program completions data.

As we worked to get the data ready for analysis, we noticed a surprisingly large number of master’s programs apparently being discontinued. Colleges can report zero graduates in a given year if the program still exists, so we assumed that programs with no data (instead of a reported zero) were discontinued. But we then looked at years immediately following the apparent discontinuation and there were again graduates. This suggests that programs with missing data periods between when graduates were reported are likely either a data entry error (failing to enter a positive number of graduates) or not reporting zero graduates in an active program instead of truly missing (a program discontinuation). This is not great news for IPEDS data quality.

We then took this a step further by attempting to find evidence that programs that seem to disappear and reappear actually still exist. We used the Wayback Machine (https://archive.org/web/) to look at institutional websites by year to see whether the apparently discontinued program appeared to be active in years without graduates. We found consistent evidence from websites that programs continued to exist during their hiatus in IPEDS data. To provide an example, the Mental and Social Health Services and Allied Professions master’s program at Rollins College did not report data for 2015 after reporting 25 graduates in 2013 and 24 graduates in 2014. They then reported 30 graduates in 2016, 26 graduates in 2017, 27 graduates in 2018, 26 graduates in 2019, and 22 graduates in 2020. Additionally, they had active program websites throughout the period, providing more evidence of a data error.

The table below shows the number of master’s programs (defined at the 4-digit Classification of Instructional Programs level) for each year between 2005 and 2020 after we dropped all programs that never reported any graduates during this period. The “likely true discontinuations” column consists of programs that never reported any graduates to IPEDS following a year of missing data. The “likely false discontinuations” column consists of programs that reported graduates to IPEDS in subsequent years, meaning that most of these are likely institutional reporting errors. These likely false discontinuations made up 31% of all discontinuations during the period, suggesting that data quality is not a trivial issue.

Number of active programs and discontinuations by year, 2005-2020.

YearNumber of programsLikely true discontinuationsLikely false discontinuations
200520,679195347
200621,167213568
200721,326567445
200821,852436257
200922,214861352
201022,449716357
201122,816634288
201223,640302121
201324,148368102
201424,76631189
201525,17041097
201625,80836166
201726,33534435
201826,80438441
201927,572581213
202027,88374223

For the purposes of our analyses, we will recode years of missing data for these likely false discontinuations to have zero graduates. This likely understates the number of graduates for some of these programs, but this conservative approach at least fixes issues with programs disappearing and reappearing when they should not be. Stay tuned for more fun findings from this project!

There are two broader takeaways from this post. First, researchers relying on program-level completions data should carefully check for likely data errors such as the ones that we found and figure out how to best address them in their own analyses. Second, this is yet another reminder that IPEDS data are not audited for quality and quite a few errors are in the data. As IPEDS data continue to be used to make decisions for practice and policy, it is essential to improve the quality of the data.

Changing Contributions to the Peer Review Process

One of the joys and challenges of being an academic is being able to help to shape the future of scholarship through the peer review process. Much has been written about the issues with academic peer review, most notably the limited incentives to spend time reviewing submissions and the increasing length of time between when an academic submits a paper to a journal and when they finally receive feedback. Heck, I wrote about this issue five years ago when The Review of Higher Education stopped accepting new submissions for about a year and a half due to this imbalance.

Throughout my ten years as a tenure-line faculty member, what I give to and take from the peer review system has changed considerably. When I was first starting on the tenure track, I was reliant on relatively quick reviews on my own submissions and was receiving 5-10 requests to review each year from legitimate journals. And since I keep a spreadsheet of the details of each journal submission, I can see that I received decisions on many articles within 2-4 months. I have never missed a deadline—typically around 30 days—to submit my thoughts as a reviewer, and have tried to accept as many requests as possible.

The peer review system changed considerably in the late 2010s. As I got closer to tenure, I received more requests to review (25-30 legitimate requests per year) and accepted them all because I was in a position to do so. Decisions on my article submissions moved more toward the 4-6 month range, which was frustrating but not a big deal for me because I figured that I had already met the standards for tenure and promotion. My philosophy at that point became to be a giver to the field because of the privileged position that I was in. I needed to review at least 2-3 times as many submissions as I submitted myself to account for multiple reviewers and so grad students and brand-new faculty did not need to review.

Going through the tenure and promotion process exposed me to another crucial kind of reviewing: external reviews of tenure applications. Most research-focused universities expect somewhere between three and eight external letters speaking to the quality of an applicant’s scholarship. I am grateful to the anonymous reviewers who accepted my department chair’s invitation to write, and now a part of my job most years as a department head is soliciting letters from some of the most accomplished (and busiest) scholars in the world.

All of this is to say that being a full professor in a field that loses a lot of full professors to full-time administrative positions (the joy of specializing in higher education!) means that my priorities for external service have changed. I am focusing my reviewing time and energy in two areas that are particularly well suited for full professors at the expense of accepting the majority of journal review requests that I receive.

The first is that I just started as an associate editor at Research in Higher Education and am thrilled to join a great leadership team after being on the editorial board for several years. I took this position because I am a big fan of the journal and I believe that we can work to improve the author experience in two key areas: keeping authors updated on the status of their submissions and quickly desk rejecting manuscripts that are outside of the scope of the journal. Researchers, please send us your best higher education manuscripts. And reviewers, please say yes if at all possible.

The second is to continue trying to accept as many requests as possible for reviewing faculty members for tenure and/or promotion. I am doing 6-8 reviews per year at this point, and it is a sizable task to review tenure packets and relevant departmental, college, and university standards. But as a department head, I am used to doing faculty evaluations and rather enjoy reading through different bylaws. It is an incredible honor to review great faculty from around the country, and it is a job that I take seriously. (Plus, as someone who solicits letters from colleagues, a little karma never hurts!)

As I prepare to enter my second decade as a faculty member, I wanted to share my thoughts about how my role has changed and will continue to change. My apologies to my fellow associate editors and editors at other journals (I will complete my term on the editorial board at The Review of Higher Education and continue to be active there), but I will say no to many of you where I would have gladly accepted a few years ago. I hope you all understand as I rebalance my scholarly portfolio to try to help the field as much as possible.

Options for Replacing Standardized Test Scores for Researchers and Rankers

It’s the second Monday in September, so it’s time for the annual college rankings season to conclude with U.S. News & World Report’s entry. The top institutions in the rankings change little from year to year, but colleges pay lots of attention to statistically insignificant movements. Plenty has been written on those points, and plenty of digital ink has also been spilled on U.S. News’s decision to keep standardized test scores in their rankings this year.

In this blog post, I want to look a few years farther down the line. Colleges were already starting to adopt test-optional policies prior to March 2020, but the pandemic accelerated that trend. Now a sizable share of four-year colleges had taken a hiatus from requiring ACT or SAT scores, and many may not go back. This means that people who have used test scores in their work—whether as academic researchers or college rankings methodologists—will have to think about how to proceed going forward.

The best metrics to replace test scores depend in part on the goals of the work. Most academic researchers use test scores as a control variable in regression models as a proxy for selectivity or as a way to understand the incoming academic performance of students. High school GPA is an appealing measure, but is not available in the Integrated Postsecondary Education Data System and also varies considerably across high schools. Admit rates and yield rates are available in IPEDS and capture some aspects of selectivity and student preferences to attend particular colleges. Admit rates can be gamed by trying to get as many students as possible with no interest in the college to apply and be rejected, and yield rates vary considerably based on the number of colleges students apply to.

Other potential metrics are likely not nuanced enough to capture smaller variations across colleges. Barron’s Profiles of American Colleges has a helpful admission competitiveness rating (and as a plus, that thick book held up my laptop for hundreds of hours of Zoom calls during the pandemic). But there are not that many categories and they change relatively little over time. Carnegie classifications focus more on the research side of things (a key goal for some colleges), but again are not as nuanced and are only updated every few years.

If the goal is to get at institutional prestige, then U.S. News’s reputational survey could be a useful resource. The challenge there is that colleges have a history of either not caring about filling out the survey or trying to strategically game the results by ranking themselves far higher than their competitors. But if a researcher wants to get at prestige and is willing to compile a dataset of peer assessment scores over time, it’s not a bad idea to consider.

Finally, controlling for socioeconomic and racial/ethnic diversity are also options given the correlations between test scores and these factors. I was more skeptical of these correlations until moving to New Jersey and seeing all of the standardized test tutors and independent college counselors that existed in one of the wealthiest parts of the country.

As the longtime data editor for the Washington Monthly rankings, it’s time for me to start thinking about changes to the 2022 rankings. The 2021 rankings continued to use test scores as a control for predicting student outcomes and I already used admit rates and demographic data from IPEDS as controls. Any suggestions that people have for publicly-available data to replace test scores in the regressions would be greatly appreciated.

New Working Paper on the Effects of Gainful Employment Regulations

As debates regarding Higher Education Act reauthorization continue in Washington, one of the key sticking points between Democrats and Republicans is the issue of accountability for the for-profit sector of higher education. Democrats typically want to have tighter for-profit accountability measures, while Republicans either want to loosen regulations or at the very least hold all colleges to the same standards where appropriate.

The case of federal gainful employment (GE) regulations is a great example of partisan differences regarding for-profit accountability. The Department of Education spent much of its time during the Obama administration trying to implement regulations that would have stripped away aid from programs (mainly at for-profit colleges) that could not pass debt-to-earnings ratios. They finally released the first year of data in January 2017—in the final weeks of the Obama administration. The Trump administration then set about undoing the regulations and finally did so earlier this year. (For those who like reading the Federal Register, here is a link to all of the relevant documents.)

There has been quite a bit of talk in the higher ed policy world that GE led colleges to close poor-performing programs, and Harvard closing its poor-performing graduate certificate program in theater right after the data dropped received a lot of attention. But to this point, there has been no rigorous empirical research examining whether the GE regulations changed colleges’ behaviors.

Until now. Together with my sharp PhD student Zhuoyao Liu, I set out to examine whether the owners of for-profit colleges closed lousy programs or colleges after receiving information about their performance.

You can download our working paper, which we are presenting at the Association for the Study of Higher Education conference this week, here.

For-profit colleges can respond more quickly to new information than nonprofit colleges due to a more streamlined governance process and a lack of annoying tenured faculty, and they are also more motivated to make changes if they expect to lose money going forward. It is worth noting that no college should have expected to lose federal funding due to poor GE performance since the Trump administration was on its way in when the dataset was released.

Data collection for this project took a while. For 4,998 undergraduate programs at 1,462 for-profit colleges, we collected information on whether the college was still open using the U.S. Department of Education’s closed school database. Looking at whether programs were still open took a lot more work. We went to college websites, Facebook pages for mom-and-pop operations, and used the Wayback Machine to find information on whether a program appeared to still be open as of February 2019.

After doing that, we used a regression discontinuity research design to look at whether passing GE outright (relative to not passing) or being in the oversight zone (versus failing) affected the likelihood of college or program closures. While the results for the zone versus fail analyses were not consistently significant across all of our bandwidth and control variable specifications, there were some interesting findings for the passing versus not passing comparisons. Notably, programs that passed GE were much less likely to close than those that did not pass. This suggests that for-profit colleges, possibly encouraged by accrediting agencies and/or state authorizing agencies, closed lower-performing programs and focused their resources on their best-performing programs.

We are putting this paper out as a working paper as a first form of peer review before undergoing the formal peer review process at a scholarly journal. We welcome all of your comments and hope that you find this paper useful—especially as the Department of Education gets ready to release program-level earnings data in the near future.

Some Updates on the State Performance Funding Data Project

Last December, I publicly announced a new project with Justin Ortagus of the University of Florida and Kelly Rosinger of Pennsylvania State University that would collect data on the details of states’ performance-based funding (PBF) systems. We have spent the last nine months diving even deeper into policy documents and obscure corners of the Internet as well as talking with state higher education officials to build our dataset. Now is a good chance to come up for air for a few minutes and provide an update on our project and our status going forward.

First, I’m happy to share that data collection is moving along pretty well. We gave a presentation at the State Higher Education Executives Officers Association’s annual policy conference in Boston in early August and were also able to make some great connections with people from more states at the conference. We are getting close to having a solid first draft of a 20-plus year dataset on state-level policies, and are working hard to build institution-level datasets for each state. As we discuss in the slide deck, our painstaking data collection process is leading us to question some of the prior typologies of performance funding systems. We will have more to share on that in the coming months, but going back to get data on early PBF systems is quite illuminating.

Second, our initial announcement about the project included a one-year, $204,528 grant from the William T. Grant Foundation to fund our data collection efforts. We recently received $373,590 in funding from Arnold Ventures and the Joyce Foundation to extend the project through mid-2021. This will allow us to build a project website, analyze the data, and disseminate results to policymakers and the public.

Finally, we have learned an incredible amount about data collection over the last couple of years working together as a team. (And I couldn’t ask for better colleagues!) One thing that we learned is that there is little guidance to researchers on how to collect the types of detailed data needed to provide useful information to the field. We decided to write up a how-to guide on data collection and analyses, and I’m pleased to share our new article on the topic in AERA Open. In this article (which is fully open access), we share some tips and tricks for collecting data (the Wayback Machine might as well be a member of our research team at this point), as well as how to do difference-in-differences analyses with continuous treatment variables. Hopefully, this article will encourage other researchers to launch similar data collection efforts while helping them avoid some of the missteps that we made early in our project.

Stay tuned for future updates on our project, as we will have some exciting new research to share throughout the next few years!

Trends in For-Profit Colleges’ Reliance on Federal Funds

One of the many issues currently derailing bipartisan agreement on federal Higher Education Act reauthorization is how to treat for-profit colleges. Democrats and their ideologically-aligned interest groups, such as Elizabeth Warren and the American Federation of Teachers, have called on Congress to cut off all federal funds to for-profit colleges—a position that few publicly took before this year. Meanwhile, Republicans have generally pushed for all colleges to be held to the same accountability standards, as evidenced by the Department of Education’s recent decision to rescind the Obama-era gainful employment era regulations that primarily focused on for-profit colleges. (Thankfully, program-level debt to earnings data—which was used to calculate gainful employment metrics—will be available for all programs later this year.)

I am spending quite a bit of time thinking about gainful employment right now as I work on a paper with one of my graduate students that examines whether programs at for-profit colleges that failed the gainful employment metrics shut down at higher rates than similar colleges that passed. Look for a draft of this paper to be out later this year, and I welcome feedback from the field as soon as we have something that is ready to share.

But while I was putting together the dataset for that paper, I realized that new data on the 90/10 rule came out with basically no attention last December. (And this is how blog posts are born, folks!) This rule requires for-profit colleges to get at least 10% of their revenue from sources other than federal Title IV financial aid (veterans’ benefits count toward the non-Title IV funds). Democrats who are not calling for the end of federal student aid to for-profits are trying to get 90/10 changed to 85/15 and putting veterans’ benefits in with the rest of federal aid, while Republicans are trying to eliminate the rule entirely. (For what it’s worth, here are my thoughts about a potential compromise.)

With the release of the newest data (covering fiscal years ending in the 2016-17 award year), there are now ten years of 90/10 rule data available on Federal Student Aid’s website. I have written in the past about how much for-profit colleges rely on federal funds, and this post extends the dataset from the 2007-08 through the 2016-17 award years. I limited the sample to colleges located in the 50 states and Washington, DC as well as to the 965 colleges that reported data over all ten years that data have been publicly released. The general trends in the reliance on Title IV revenues are similar when looking at the full sample, which ranges from 1,712 to 1,999 colleges across the ten years.

The graphic below shows how much the median college in the sample relied on Title IV federal financial aid revenues in each of the ten years of available data. The typical institution’s share of revenue coming from federal financial aid increased sharply from 63.2% in 2007-08 to 73.6% in 2009-10. At least part of this increase is attributable to two factors: the Great Recession making more students eligible for need-based financial aid (and encouraging an increase in college enrollment) and increased generosity of the Pell Grant program. Title IV reliance peaked at 76.0% in 2011-12 and has declined each of the most recent five years, reaching 71.5% in 2016-17.

Award Year Reliance on Title IV (pct)
2007-08 63.2
2008-09 68.3
2009-10 73.6
2010-11 74.0
2011-12 76.0
2012-13 75.5
2013-14 74.6
2014-15 73.2
2015-16 72.5
2016-17 71.5
Number of colleges 965

I then looked at reliance on Title IV aid by a college’s total revenues in the 2016-17 award year, dividing colleges into less than $1 million (n=318), $1 million-$10 million (n=506), $10 million-$100 million (n=122), and more than $100 million (n=19). The next graphic highlights that the groups all exhibited similar patterns of change over the last decade. The smallest colleges tended to rely on Title IV funds the least, while colleges with revenue of between $10 million and $100 million in 2016-17 had the highest shares of funds coming from federal financial aid. However, the differences among the groups were less than five percentage points from 2009-10 forward.

For those interested in diving deeper into the data, I highly recommend downloading the source spreadsheets from Federal Student Aid along with the explanations for colleges that have exceeded the 90% threshold. I have also uploaded an Excel spreadsheet of the 965 colleges with data in each of the ten years examined above.

How to Maintain Research Productivity

This summer is my first summer after receiving tenure at Seton Hall. While tenure and promotion to associate professor officially do not kick in until the start of the next academic year in August, there have already been some changes to my job responsibilities. The most notable change is that I have taken over as the director of the higher education graduate programs at Seton Hall, which means taking on a heaping helping of administrative work that is needed to make things run smoothly. While this work does come with a teaching reduction during the academic year, it’s a year-round job that takes a hefty bite out of my schedule. (And yes, professors do work—which is often unpaid—during the summer!)

Over the past few years, a few other factors have contributed to sharply reduce the amount of available time that I have to work on research. Since I teach in a doctoral program, faculty members are typically asked to chair more and more dissertation committees as they gain more experience. I also spend quite a bit of time on the road giving talks and being in meetings on higher education policy issues across the country, which is a great opportunity to catch up on reading dissertations in transit but makes it hard to write. These demands have really hit hard over the last few months, which is why blog posts have been relatively few and far between this year.

I had the chance to participate in a panel discussion through Seton Hall’s Center for Faculty Development last academic year on the topic of maintaining research productivity. I summarize some of my key points below, and people who are interested can listen to the entire podcast. Hopefully, some of these tips are especially useful for new faculty members who are beginning the exciting transition into a tenure-track position and often face more demands on their time than they faced in the past.

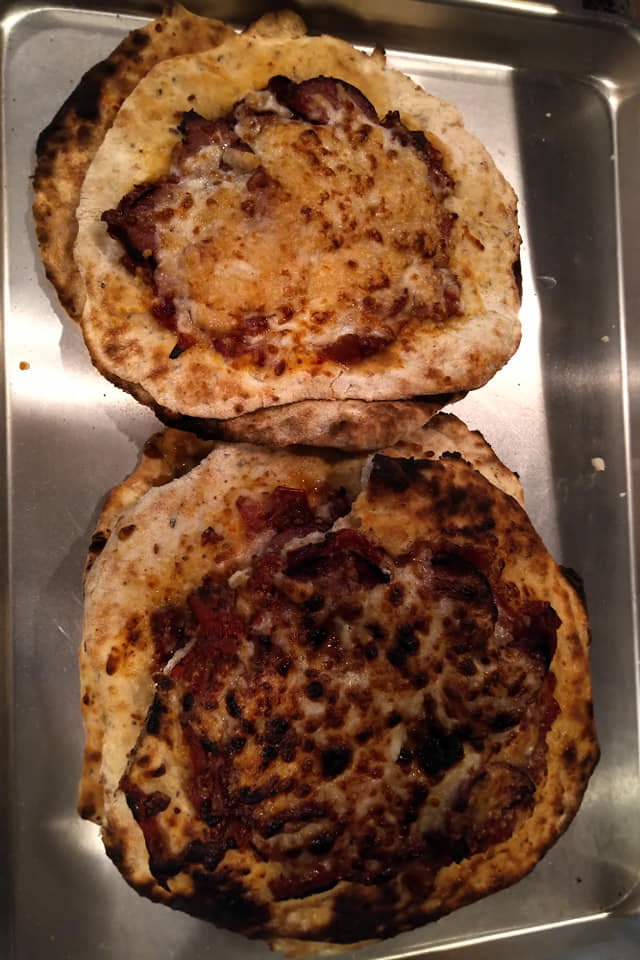
(1) Take care of yourself. One challenge of being a faculty member is that an unusually large proportion of our time is unstructured. Even for colleagues who teach three or four classes a semester (I teach two), direct teaching and office hour obligations may only be 20 hours per week. But the amount of work to do is seemingly infinite, resulting in pressures to work absurd hours. Set a reasonable bound on the number of hours that you are willing to work each week and stick to it the best that you can. Also make sure to have some hobbies to get away from the computer. I enjoy running, gardening, and cooking—as demonstrated by these homemade pizzas from last weekend.

(2) Keep your time allocation in mind. In addition to not working too many hours each week, it is important to be spending time on what is eventually rewarded. If your annual review or tenure/promotion guidelines specify that your evaluation is based 40% on research, 40% on teaching, and 20% on service, it is an issue to be spending 25 hours each week on teaching. Talk with experienced faculty members or trusted colleagues about what you can do to improve your teaching efficiency. If efficiency isn’t the issue, it’s time to talk with trusted colleagues about what can be done (if anything) to protect your time for research. I do my best to block off two days each week for research during the academic year, although that does get tough with travel, conference calls, and interviews.

Another helpful hint is structuring assignment due dates so you don’t get overwhelmed. I usually have a conference to attend during the middle of the semester, so I schedule the due date for midterm papers to be right before the trip. That way, I can read papers on the train or plane (since I’m not good at writing away from my trusted home office).

(3) Guard your most productive writing time. Most faculty members that I talk with have a much harder time getting into a research mindset than getting into a teaching or service mindset. This means that for many people, their writing time needs to be the time of day in which they are at their sharpest. Being able to control when you teach and meet with students is often outside your control, but deciding when to answer e-mails and prepare classes typically is. It’s hard enough to write, so blocking off several of your most productive hours each week to write is a must when tenure and promotion depend on it. Conference calls and nonessential meetings can fit nicely into the rest of your week.

(4) Collaborations can be awesome. (Caveat: Make sure your discipline/institution rewards collaborative research first. Most do, but some don’t.) In the tenure and promotion process, it is crucial for faculty members to be able to demonstrate their own research agenda and contribution to their field of study. But strategically using collaborations in addition to sole-authored projects can be a wonderful way to maintain research productivity and stay excited about your work. I have been fortunate to work with a number of great collaborators over the last few years, and just had a great time last week going out to Penn State to meet with my colleagues on a fun research project on state performance funding policies. These collaborations motivate me to keep working on new projects!

Colleagues, I would love to hear your thoughts about how you keep your research agenda moving forward amid a host of other demands. Either comment below or send me a note; I would love to do a follow-up post with more suggestions!