Exploring Trends in Pell Grant Receipt and Expenditures

The U.S. Department of Education released its annual report on the federal Pell Grant program this week, which is a treasure trove of information about the program’s finances and who is receiving grants. The most recent report includes data from the 2012-13 academic year, and I summarize the data and trends over the last two decades in this post.

Pell Grant expenditures decreased from $33.6 billion in 2011-12 to $32.1 billion in 2012-13, following another $2.1 billion decline in the previous year. After adjusting for inflation, Pell spending has increased 258% since the 1993-94 academic year.

pell_fig1

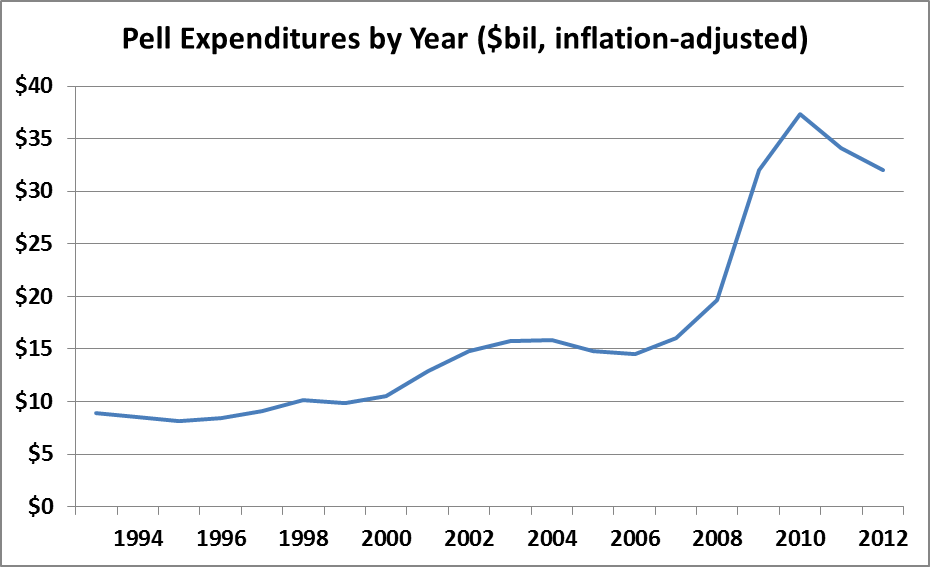
Part of the increase in spending is due to increases over the maximum Pell Grant over the last 20 years. Even though the maximum Pell Grant covers a smaller percentage of the cost of college now than 20 years ago, the inflation-adjusted value rose from $3,640 in 1993-94 to $5,550 in 2012-13.

pell_fig2

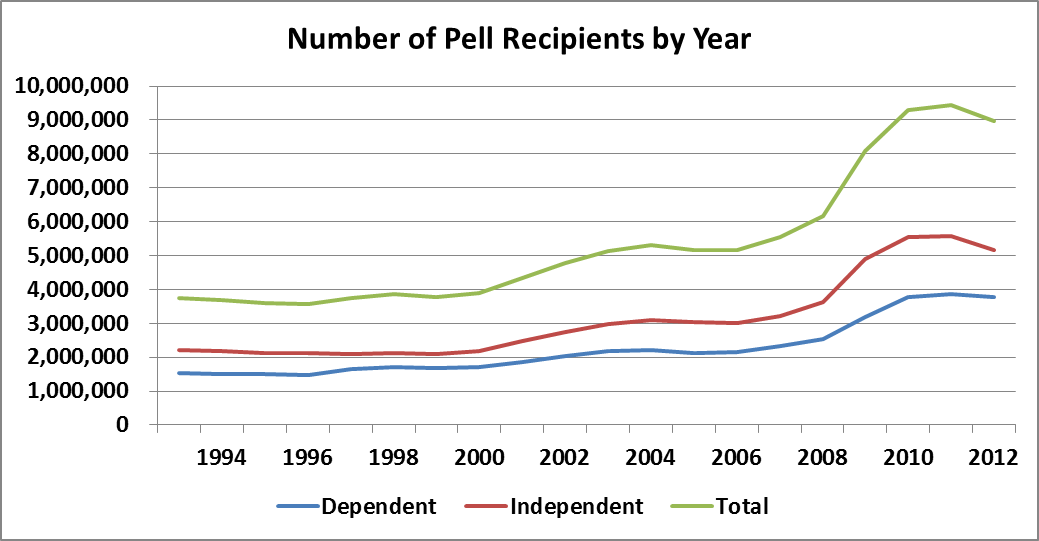
The number of Pell recipients has also increased sharply in the last 20 years, going from 3.8 million in 1993-94 to just under 9 million in 2012-13. However, note the decline in the number of independent students in 2012-13, going from 5.59 million to 5.17 million.

pell_fig3

Recent changes to the federal calculation formula has impacted the number of students receiving an automatic zero EFC (and the maximum Pell Grant), which is given to dependent students or independent students with dependents of their own who meet income and federal program participation criteria. Between 2011-12 and 2012-13, the maximum income to qualify for an automatic zero EFC dropped from $31,000 to $23,000 due to Congressional action, resulting in a 25% decline in automatic zero EFCs. Most of these students still qualified for the maximum Pell Grant, but had to fill out more questions on the FAFSA to qualify.

pell_fig4

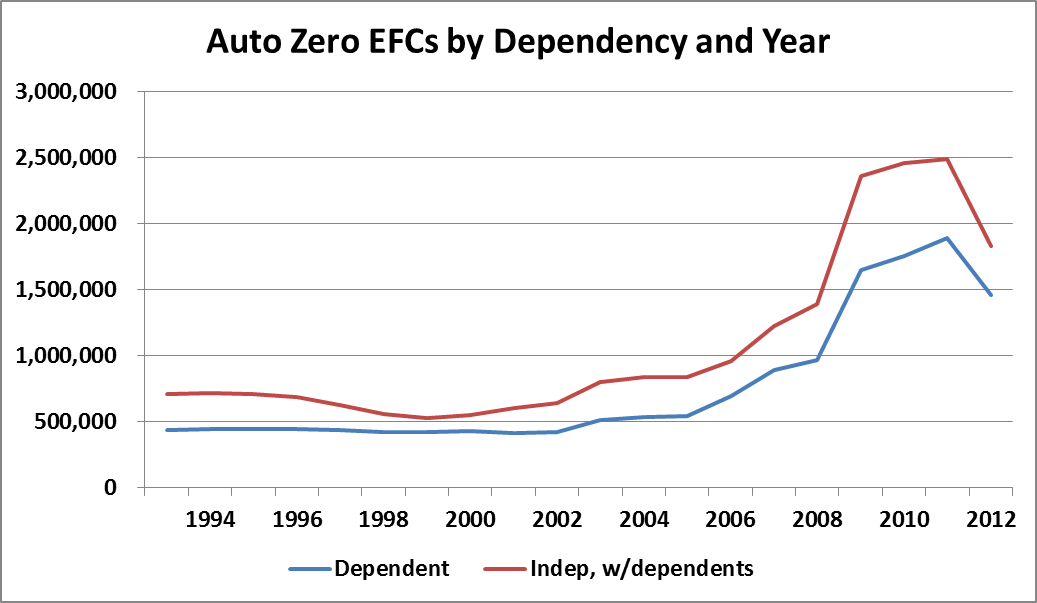
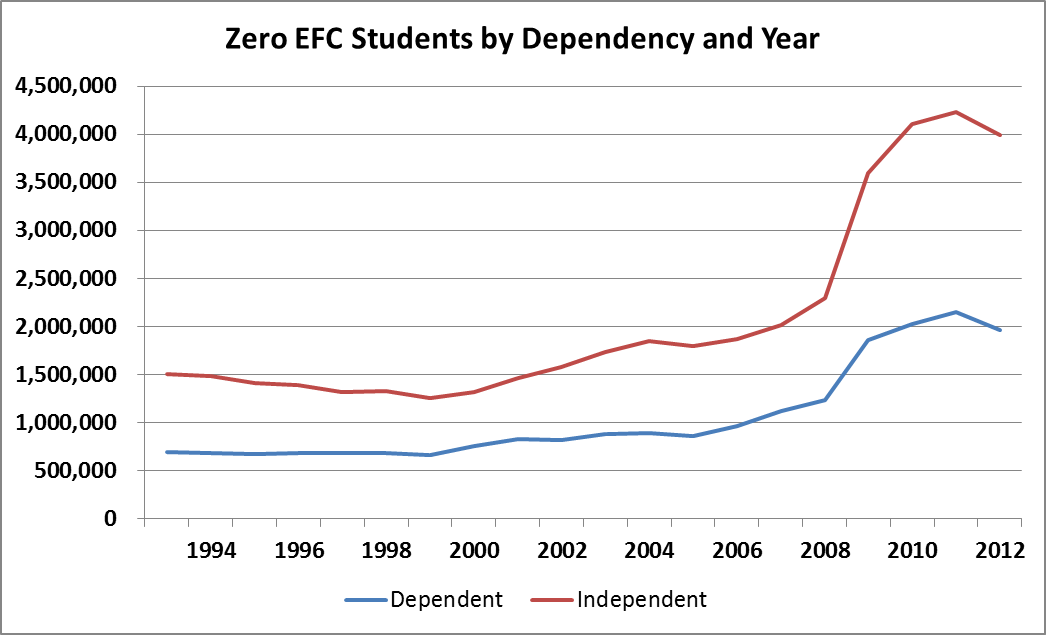
The number of students receiving a zero EFC (automatic or calculated) dropped by about 7% from 2011-12, or about 400,000 students, after more than doubling in the last six years. Part of this drop is likely due to students choosing a slowly recovering labor market over attending college.

pell_fig5

UPDATE: Eric Best, co-author of “The Student Loan Mess,” asked me to put together a chart of the average Pell award by year after adjusting for inflation. Below is the chart, showing a drop of nearly $500 in the average inflation-adjusted Pell Grant in the last two years after a long increase.

pell_fig6

I hope these charts are useful to show trends in Pell receipt and spending over time, and please let me know in the comments section if you would like to see any additional analyses.

The Starbucks-ASU Online Program: More Short than Venti?

I’ve got a piece in today’s Inside Higher Ed explaining why I don’t think Starbucks’s partnership with Arizona State University Online will result in a large number of degree completions. Starbucks is getting a lot of great PR for this program, some of which is deserved for making an opportunity available and for working with Inside Track to provide additional counseling to students. However, the conditions set forth in the announcement (extremely delayed reimbursement, the last-dollar nature of the program, and only one participating online institution) makes it unlikely that the takeup rate will be very high.

Read the piece and let me know what you think!

The Political Attractiveness of “Last-Dollar” Scholarships

The old adage about there being no such thing as a free lunch may hold true regarding a turkey sandwich on rye bread, but free lunches can happen in the world of higher education. An example of this is the growing number of “last-dollar” scholarships, in which private entities or state/local governments agree to cover students’ remaining tuition and fees after all federal grants have been provided. (Note that it does not cover room and board or living expenses—an important component of the total cost of attendance.)

Consider this hypothetical example of a last-dollar scholarship. A student with a zero expected family contribution (EFC) qualifies for a maximum Pell Grant ($5,730 for the 2014-15 academic year) and a Supplemental Educational Opportunity Grant of $1,500. If she enrolls at a public university with tuition and fees of $9,000 per year, the last-dollar scholarship would then cover the remaining $1,270. But if she goes to a community college with tuition and fees of $5,000 per year, the last-dollar scholarship does not pay a dime.

Bryce McKibben of the Association of Community College Trustees (ACCT) analyzed the implications of the new Tennessee Promise scholarship, which promises students free community college tuition and fees if they meet a relatively restrictive set of eligibility criteria. The program is estimated to cost about $34 million per year, suggesting that not many students will benefit. McKibben’s piece mentioned that 35% of Tennessee community college students have a zero EFC, meaning these students will get no additional funds from the program as the maximum Pell Grant of $5,730 far exceeds full-time tuition and fees of under $4,000 per year. Indeed, an analysis by the Tennessee Higher Education Commission showed that the median student with an EFC of under $2,100 would not see a dime from the Tennessee Promise:

aid_by_efc

This doesn’t mean that last-dollar scholarships don’t have value. They do benefit community college students who barely miss qualifying for the federal Pell Grant, as well as students attending four-year institutions (such as under Indiana’s 21st Century Scholarship program). Another important benefit of last-dollar scholarship programs is informational. Students may be induced to attend college simply by having better knowledge of what college costs, even if they do not receive any additional money. The literature on college promise programs, as I summarized in this paper, suggests that informational campaigns can increase college enrollment rates by several percentage points.

Last-dollar scholarships are politically attractive due to their clear message about college costs (even if they’re excluding any housing or living expenses) and relatively low cost. If the goal is to help the neediest students afford college, however, states may want to consider adding stipends to students whose tuition is already covered by funds from other sources.

Come See Me at AERA!

I’m involved in two presentations at this weekend’s gigantic American Educational Research Association conference in Philadelphia. (And I’m not kidding about the gigantic part. There are often more than 100 sessions going on at any particular time!)

“Making Sense of Loan Aversion: Evidence from Wisconsin.” (Friday, 2:15-3:45, Marriott, 407) I’ve worked on this paper with Sara Goldrick-Rab of the University of Wisconsin-Madison (this year’s recipient of an early career award from AERA), who will be giving the presentation. In this presentation, she will talk about our work looking at loantaking patterns among a sample of Pell recipients from the state of Wisconsin.

“Financial Need and Income Volatility among Students with Zero Expected Family Contribution.” (Sunday, 10:35-12:05, Marriott, Fourth Level, Franklin 11) In this paper, I look at students with zero EFC using both nationally representative data and student-level FAFSA data from nine colleges and universities. I examine trends in zero EFC receipt, as well as breaking down zero EFC students into groups based on how the EFC was calculated (full FAFSA, simplified FAFSA excluding assets, and automatic zero EFC). Here are the slides from this presentation.

I hope to see you at AERA, and please send along any sessions that I should attend between Friday and Sunday!

The Black Hole of PLUS Loan Outcomes

Much of the debate about improving federal higher education data quality has focused on whether a student unit record dataset is necessary in order to give students, their families, and policymakers the information they need in order to make better decisions. Last month’s release of College Blackout: How the Higher Education Lobby Fought to Keep Students in the Dark by Amy Laitinen and Clare McCann of the New America Foundation highlighted the potential role of the higher education lobby in opposing unit record data. However, privacy advocates note the concerns with these types of datasets—and these are concerns that policymakers must always keep in mind.

Colleges are already required as a condition of the Higher Education Act to report institutional-level data on some outcomes to the federal government, which are then typically made publicly available through the Integrated Postsecondary Education Data System (IPEDS). In what is an annoying quirk of the federal government’s data reporting systems, the best source for data on the amount of certain types of aid received (such as work-study or the Supplemental Educational Opportunity Grant) is the Office of Postsecondary Education’s website and is not available through IPEDS. Student loan default rates (for Stafford loans) are available on Federal Student Aid’s website, which is also not tied to IPEDS. The lack of a central database for all of these data sources is a pain for analysts (consider the technical appendix to my paper on campus-based aid programs), but it typically can be overcome with a mix of elbow grease and knowledge of the difference between UnitIDs and OPEIDs.

Yet, until last week, we knew absolutely nothing about the outcomes for students and families who took out federal PLUS loans. These loans, which require a credit check for the parents of undergraduate students, have gained attention recently due to the federal government’s 2011 decision to tighten eligibility criteria in order to reduce default rates. This disproportionately affected enrollment at historically black colleges and universities, many of which are private and do not have large endowments that provide institutional aid funds. Some analysts, such as Rachel Fishman at New America, have called for PLUS loans to be severely curtailed or even eliminated.

The Department of Education provided a negotiated rulemaking committee with data on PLUS denial rates and default rates by institutional sector (public, private nonprofit, and for-profit) last week, marking the first time these data had even been made public. These data were only provided after members of the committee complained about a lack of data on the proposals they were discussing. (The data are available here, under the pre-session 2 materials header.) The data on loan balances suggests that the average parent PLUS loan balance among borrowers at four-year private colleges is $27,443, compared to $19,491 at four-year publics and $18,133 at four-year for-profit institutions. Three-year default rates at for-profit colleges were 13.3% in fiscal year 2010, compared to 3.4% at private nonprofits and 3.1% at public institutions. And the total amount of outstanding PLUS loans (undergraduate and graduate students combined) is just over $100 billion, or roughly 10% of all student loan debt.

A piece in Thursday’s Inside Higher Ed quoted a HBCU president who noted that there was no reason to tighten loan criteria given the low default rates in the data. But the public has no idea what any college’s default rate is on PLUS loans, given the release of broad sector-level data. The piece goes on to note that the Department of Education says institutional-level data are not available for PLUS loans, in part because there is no appeal process in place for colleges. This has the effect of insulating programs that take in large amounts of PLUS funds, do not graduate those students, and as a result they default. Right now, there is no accountability whatsoever.

The Department of Education needs to release institutional-level PLUS loan data to improve transparency and accountability. However, they claim that these measures do not exist—an assumption which borders on the absurd given the existence of the data in the National Student Loan Data System and their ability to calculate sector-level measures. ED’s response has been that colleges do not have the ability to appeal the data, but this can be easily remedied. In the meantime, I hope that the higher education community uses the Freedom of Information Act to request these data—and that advocates are willing to go to court when ED says the data do not exist.

The 2014 Net Price Madness Tournament

It’s time for my second annual Net Price Madness Tournament, in which colleges which have men’s basketball teams in the NCAA Division I tournament are ranked based on net price in a tournament format. In last year’s Net Price Madness, North Carolina State, North Carolina A&T, Northwestern State (LA), and Wichita State were the regional winners for the lowest net price among students who received any financial aid in the 2011-12 academic year. And the Shockers did go on to advance to the Final Four, so maybe this method has a tiny correlation to basketball success!

Here are the results for the 2014 Net Price Madness Tournament in a convenient spreadsheet that also includes winners for each game, net price by income level, percent Pell, and six-year graduation rates. The regional winners for 2014 are:

East: North Carolina Central University (14): $8,757 net price, 64% Pell, 43% grad rate

Midwest: Wichita State University (1): $8,645 net price, 36% Pell, 41% grad rate

South: University of New Mexico (7): $11,001 net price, 39% Pell, 46% grad rate

West: University of Louisiana-Lafayette (14): $5,891 net price, 35% Pell, 44% grad rate

And here is the full bracket:

netprice_bracket

Congratulations to these institutions, and a big raspberry to the nine colleges that charged a net price of over $20,000 to the typical student with household income below $30,000 per year. Feel free to use these data to inform your rooting interests!

UPDATE 3/17 Noon ET: Mark Huelsman of Demos drew my attention to the oddity that Wichita State’s net price for all students ($8,645) is far lower than the net price for each of the three lowest income brackets (roughly $12,500 to $13,500). I investigated the IPEDS data report from WSU and discovered that 706 of the 721 WSU first-year, full-time, in-state students receiving Title IV financial aid (listed as Group 4) were reported as having incomes below $30,000 in 2011-12; similar percentages existed for the previous two years.

The sample for the full net price number is somewhat different–it’s first-year, full-time, in-state students receiving any grant aid (including the institution, listed as Group 3). This sample has 902 students, 179 more than the previous sample. Comparing net tuition revenue from the two groups, Group 4 had roughly $9.5 million in net revenue in 2011-12 and the larger Group 3 had $7.8 million in net revenue. This is unusual, to say the least, and it is possible that one of the net price numbers listed in IPEDS is incorrect. I’m continuing to investigate this point.

Should Campus-Based Financial Aid Be Reallocated?

I am presenting a paper, “Exploring Trends and Alternative Allocation Strategies for Campus-Based Financial Aid Programs,” at the Association for Education Finance and Policy’s annual conference this afternoon.  Here is the abstract:

Two federal campus-based financial aid programs, the Supplemental Educational Opportunity Grant (SEOG) and the Federal Work-Study program (FWS), combine to provide nearly $2 billion in funding to students with financial need. However, the allocation formulas have changed little since 1965, resulting in community colleges and newer institutions getting much smaller awards than longstanding private colleges with high costs of attendance. I document the trends in campus-level allocations over the past two decades and explore several different methods to reallocate funds based on current financial need while limiting the influence of high-tuition colleges. I show that allocation formulas that count a modest amount of tuition toward financial need reallocate aid away from private nonprofit colleges and toward public colleges and universities.

And here are the slides from my presentation, summarizing the study (which is still a work in progress). Any comments are greatly appreciated!

Come See Me at AEFP!

I’m presenting two papers at the annual conference of the Association for Education Finance and Policy (AEFP) this week in San Antonio. Below are short descriptions of the papers that I’ll be presenting, along with information about the time and room location.

Are Federal Allocations for Campus-Based Financial Aid Programs Equitable and Effective?(Thursday at 2:45 PM, Conference Room 4, Third Floor)

Abstract: Two federal campus-based financial aid programs, the Supplemental Educational Opportunity Grant (SEOG) and the Federal Work-Study program (FWS), combine to provide nearly $2 billion in funding to students with financial need. However, the allocation formulas have changed little since 1965, resulting in community colleges and newer institutions getting much smaller awards than longstanding private colleges with high costs of attendance. I document the trends in campus-level allocations over the past two decades and explore several different methods to reallocate funds based on current financial need while limiting the influence of high-tuition colleges. I show that allocation formulas that count a modest amount of tuition toward financial need reallocate aid away from private nonprofit colleges and toward public colleges and universities.

A Longitudinal Analysis of Student Fees: The Roles of States and Institutions(Saturday at 9:45 AM, Conference Room 12, Third Floor)

Abstract: Student fees are used to finance a growing number of services and programs at colleges and universities, including core academic functions, and make up 20% of the total cost of tuition and fees at the typical four-year public college. Yet little research has been conducted to examine state-level and institutional-level factors that may affect student fee charges. In this paper, I use state-level data on tuition and fee policy, the role of state governments and higher education systems, and partisan political balance combined with institutional-level data on athletics programs and selectivity to create a panel from the 1999-2000 to 2011-12 academic years. I find that some state-level factors that would be expected to reduce student fees, such as fee caps, do reduce fees at four-year public colleges, but giving the legislature authority to set fees results in higher fees. Additional state grant aid and higher-level athletics programs are also associated with higher fees in my primary model.

I welcome any feedback you may have on either of these papers, as they are both preliminary works that still need polishing at the very least. I hope to see you at AEFP!

Can Parents Be Forced to Pay for College?

The recent case of 18-year-old Rachel Canning, a New Jersey teenager who moved out of her parents’ house and sued to force them to pay for private high school and future college tuition, has gained national attention. Although a Morris County judge denied Ms. Canning’s emergency request for $600 per week in emergency support, the case will continue to wind its way through New Jersey’s legal system. The final decision will determine whether she is an emancipated minor, as her parents claim, or whether she is dependent on her parents, as she claims.

The issue of whether parents should contribute toward their child’s college education is nothing new, although the FAFSA does assume that parents will contribute. Under current FAFSA rules, students are automatically considered to be dependent on their parents for financial aid purposes until they reach at least the age of 23 unless they marry, have children, join the military or meet at least one criterion regarding self-support. Some students would like to be declared as being independent in order to get additional financial aid, particularly if their parents are wealthy but do not want to contribute toward the expected family contribution (EFC). But if this were allowed, federal financial aid costs would skyrocket as families choose the dependency status that works best for them.

The result of this case would impact her federal financial aid eligibility. The relevant criterion in the Canning case is whether she has been classified as an emancipated minor by a New Jersey court, which would be the case if her parents win. In that case, and if her parents do not have to give her money to pay for college, Ms. Canning would be classified as an independent student with an EFC of close to zero—resulting in the maximum Pell Grant. But if Ms. Canning wins, then she would have to consider her parents’ income and assets on the FAFSA and she would likely get little to no federal financial aid; however, she would get some money from her parents through winning the case.

So will Canning v. Canning affect the structure of federal financial aid going forward? Probably not. But it still bears watching as the lawsuit could help to set precedent over the issues of emancipated minors and paying for college. I’ll keep an eye on the case—if for no other reason than it’s dominating the local news in New Jersey!

Are Free Lunches the Obama Administration’s Financial Aid Simplification Policy?

Politico’s Morning Education newsletter reported today that First Lady Michelle Obama will announce that all school districts with at least 40 percent of students eligible for free or reduced price lunches (FRL) will be given funds so all students in the district receive free meals. Currently, districts can get federal funds to give all students free meals if a much higher percentage of students is FRL eligible; lowering the threshold has the potential to reduce the stigma of receiving government benefits.

But from a higher education perspective, making more students eligible for FRL could have substantial implications for federal financial aid policy. Under current rules, students who had a family member receive FRL in the last two years would be eligible for a simplified FAFSA (eliminating parent and student/spouse asset questions) for the 2014-15 academic year if family income was below $50,000 in the previous year. That student could be eligible for an automatic zero EFC (and the maximum Pell Grant) if a family member received FRL in the past two years and family income was below $24,000 in the previous year.

This announcement means that some students in high-poverty schools may be able to file a simplified FAFSA as a result of now receiving FRL. FRL eligibility currently goes up to 185% of the federal poverty line, which was about $43,500 per year for a family of four in 2013. Students from families making more than 185% of the federal poverty line but less than $50,000 may now be able to file a much shorter and less intrusive version of the FAFSA. This policy change has the potential to increase access and potentially even financial aid awards for some students, and the resulting natural experiment should be rigorously examined.

The meaning of this change for early commitment programs, in which financial aid is tied to a student’s circumstances well before entering college, are less clear. For example, consider the idea that Sara Goldrick-Rab and I proposed of an early Pell program based on eighth grade means-tested program receipt (forthcoming in The Journal of Higher Education).  Granting universal free lunch eligibility to all students in a district may result in higher-income students becoming Pell-eligible based on their district of attendance. This may not be a bad thing (particularly if it voluntarily encourages more socioeconomically diverse schools), but it would reduce the program’s targeting and increase costs. Perhaps an income limit would need to be considered to gain eligibility in eighth grade.

I’ll be keeping an eye on this policy development and how it could affect financial aid policy going forward.